Outfitting processes in shipbuilding are marked by different technical crews installing specific components in a determined order. Capturing building progress data can help to efficiently control the work
Process mapping on shipyards revealed a low level of digitization throughout the outfitting processes. The resulting low transparency regarding current[ds_preview] state and progress of construction often leads to miscommunication. Assembly errors and defects are reported too late or not detailed enough. The lack of information requires additional coordination of suppliers and technical crews. Besides, the productivity gets lowered by unplanned supplementary work and no value-adding activities as searching for persons in charge. To resolve the problems and meet the agreed costs and delivery dates, a simple and affordable solution for capturing the current state of construction in the ship is needed.
Shipyards already use photographs and 360° photography to capture details or whole rooms. This can be done with small devices, but still only delivers a two-dimensional image of the room. The use of 3D laser scanners solves this problem and enables the user to move through a digital copy of the ship. Nevertheless, 3D scanners are expensive and need to be carried as an extra tool, even if they are handheld. Doing an optical measurement requires an extra walk into the ship because the scanner is heavy and bulky.
Different research projects tried to overcome the named problems by capturing the current state of construction as a point cloud. As shown in the project PROSPER, selecting the expedient tool depends on different factors as size of a room, light conditions, accuracy, mobility, costs and others. Applicable hardware for capturing parts as a three-dimensional object are laser scanners, 3D cameras as Kinect or common digital cameras that create a point cloud after using photogrammetric software, as was demonstrated by a team of researchers at the technical University of Hamburg-Harburg (TUHH) in 2016.
Results of process mapping and interrogation of employees and suppliers at a shipyard also revealed, that usability is another important factor to include into the decision process. Therefore capturing the as-built state through photogrammetry was focused. Still the method can be changed into laser scanning if a high resolution is needed.
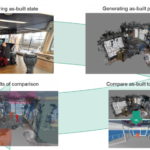
To keep the physical stress and the additional amount of equipment low, camera systems like digital single lens reflex cameras are replaced by mobile devices. These are handy and as they became an everyday object, people are used to handle it and therefore need no special training. Cameras of smartphones are practicable for photogrammetric use. The captured data is transferred into a point cloud, which is compared to the 3D model of the ship afterwards. The following figure shows the entire workflow.
The workflow starts with capturing the as-built state in the ship with a mobile device. Therefore, tablets and smartphones were tested in the ship first to ensure that the method is suitable. To minimize the problem of holes in the point cloud caused by insufficient overlap in the taken pictures, videos instead of normal photographs were taken. Recording a video also results in a shorter time exposure compared to taking pictures. To ensure, that the data capturing can be done with any consumer mobile device and by untrained users, the videos in the first tests were recorded in default video mode regardless any settings. Further tests in a room with different lighting situation were done to compare the results of the mobile device to the results of laser scanner and digital consumer camera.
To generate a point cloud, the captured data needs to be processed. Therefore the user transfers the video to a computer where single pictures need to be extracted. Tests with regard to extraction rates showed, that the optimal extraction rate is two to three pictures/second. A lower extraction rate leads to the risk of insufficient overlap between two pictures. The generation of a point cloud is started after extracted photos are loaded into photogrammetry software.
First tests showed that the results of processing depend much on the lighting situation. Videos of rooms with a constant level of lighting delivered much better results than rooms with a huge window front on one side and a dark area on the other side. Further tests revealed that results become better if autofocus and image stabilizer are switched off while shooting the video. Another finding was that smooth and single-colored surfaces often cause holes in the point cloud. To overcome this issue, additional markers can be used for this kind of surfaces.
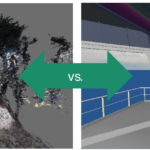
Another product of photogrammetry can be a mesh instead of a point cloud. This might be a better result for reviews, as the surfaces can be identified more easily. As a next step, the before created point clouds can be compared to a given 3D model. Besides simple visual survey of the mesh or point cloud, also coloring the parts pursuant to their existence in the point cloud is possible. Both methods only give a general overview regarding installation status in a room.
A more detailed result is given by an automatic comparison of point cloud and 3D model. Every digital part that is found in the form of points can be marked as installed. Additionally, the individual part and the fitting points can be viewed solitary. Results of the comparison can be presented in a list that is sortable by room, responsible supplier or status of the installation.
Results from data capturing and comparison will be uploaded to a monitoring platform that is accessible for contributing employees and suppliers. Visibility settings can be adjusted appropriate to the shipyards wishes and security guidelines. Regardless detailed settings every supplier should be able to log in and check whether he can start installation on schedule.
A schematic profile view into the ship can be used to show the progress for specific areas. Status indicators like colored and filled circles represent the corresponding level of completion. By clicking into an area, like a deck, the view will get more detailed. The most granular view shows every room colored accordingly its state of installation. The following figure shows an example for the first view.
Besides current state of construction, a list of installed or missing parts and the 3D point cloud, other data can be uploaded. For example technical drawings could be attached and dependent crafts would be informed if a change in design occurs.
Summed up, the monitoring platform enables the user to glance a view into the ship at any time and any place. The immediacy of information depends on the frequency of data acquisition, which should be determined. According to whether a special person is responsible for capturing the room or every worker can shoot a video after finishing his work of a day, the update rate differs.
The described process can be conducted with any mobile device as an addition to conventional laser scanning which has to be done anyway for reasons of quality assurance. It is planned to replenish weekly laser scans with daily created point cloud from mobile devices. Changes on schedule can be reported via monitoring platform even if no point cloud was created. The most important step is to increase transparency and immediacy of information about construction progress for the shipyard and participating suppliers to minimize coordination effort, delays and costs.
Anne Fischer, Jan Sender, Daniel Roisch, Fraunhofer IGP, Wilko Flügge


