The declining bunker prices could probably lead to a reversal of the slow stea-ming trend. Since several years, this is an important factor in liner shipping. Michael Tasto reviews the change in the modus operandi of round trip time
In the years following China’s ascension to the World Trade Organisation, box handling volumes have been surging in ports worldwide[ds_preview] and containership capacity was scarce and hence expensive. As a result, liner shipping companies typically only operated at or close to full design speed on the arterial trades. The years from 2006 to the first half of 2008 brought a bit of a paradigm change as tonnage growth started to outpace demand growth and bunker-prices reached previously unseen heights. But still, the prevailing credo seemed to be that faster was better. Then, the financial crisis struck and drove a harsh gap between supply and demand. This gap persisted and when bunker prices settled at ~600$/ton in the following years, shipping lines slowed down significantly. As a result, the container shipping business of today is a different industry compared to the one ten years ago especially since the ratio of charter costs and bunker costs has been reversed.
Aside from the astonishing and somewhat unpredictable evolution of vessels sizes during the period under review, two key parameters of the industry have undergone a significant change recently. First of all, the cost structure of the liner shipping industry has been turned upside down with the escalating bunker prices since around 2005 and second, the global recession of 2009 has presented the industry with a previously unseen amount of excess-capacity (and strictly speaking probably also its first real shipping cycle).
Bunker prices and charter rates
If, at the end of the nineties, shipping lines were moaning about high bunker prices, they have been referring to those rare times, when the price of a ton of heavy fuel oil actually exceeded 100$. Although the ships of that time have been significantly less fuel efficient than today’s modern counterparts, the bunker costs accounted only for a small share of the total round trip costs. This changed in the new millennium, when the price of bunker started to rise to ever higher levels. But even though the (at that time) record high bunker prices of 2005 have certainly been higher than deemed thinkable at the start of the millennium, container tonnage was in short supply and hence extraordinary expensive – judging from the development of the time charter rates. Change is taking place progressively in the years 2006 to 2008, as the somewhat overheated chartermarkets appear to be cooling down and the bunker prices continue to increase. Trade press articles during these years were busy discussing the economic merits of slow-steaming in the face of the record high bunker price, but »slow steaming« at that point meant something different, than it does since 2009.
But the development did not come to a standstill in 2008 and after the dust, which the global recession of 2009 had raised, began to settle, the time charter rates (at least for those vessels with a well documented market) settled at relatively poor levels, whilst heavy fuel oil has not really been available for much less than 600$/ton during the last years – 2014 with its relatively low prices as well as the radically reduced prices offered at beginning of the year 2015 being somewhat of an exception.
Supply and demand
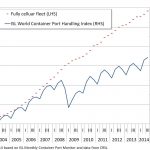
In contrast to the extremely high time charter rates of the year 2005, which suggest an equivalently extreme scarcity of available TEU-capacity, the time charter rates of the recent years hint towards an overcapacity and the notoriously persistent idle fleet (in October 2014 down to ~200,000TEU according to Alphaliner) has helped (from the point of view of the shipping lines) to prevent a sustained recovery of time charter rates for smaller vessels (up to the current definition of Panamax container vessels).
There still seems to be a reasonably large gap between supply and demand, which came into existence ever since the first ever annual volume decline of global container port handling in 2009. But this is only partly true. This »mathematical« gap is mitigated by the increased use of slow-steaming which became the new industry standard in recent years and which partly helped to neutralize the capacity growth by including the new vessels into existing services and slowing said services down simultaneously. Recent estimates from Alphaliner suggest that as of fall 2014, up to 1.3mill. TEU of containership capacity have been tied up through the increased use of slow-steaming since summer 2009.
Round trip times on arterial trades
The following sections review the evolution of round trip times on the key arterial trade lanes from 1995 to 2014. The analysis is based on data from MDS-transmodal. The tables highlight the shift of standard round trip times over the course of 20 years. The fields of the matrix show the amount of services with a given round trip time of n weeks (columns) at the start of the years (rows). Typically, the industry standard has always been to offer weekly sailings. Those services have been counted as one complete service each. In addition to that, some carriers offer bi-weekly services, with equivalent round trip frequencies. Those services have been counted as »half services«, which explains how it is possible, that the tables will feature »1.5« or »9.5« (…) services occasionally. The reason why this approach was chosen is that it seems to reflect the number/volume of services at any given point of time more precisely.
Far East-North Europe
Typically brokers and analysts are referring to the »Far East-Europe« trade, when discussing the market volume or talking about the longest arterial trade. However, this definition would also contain services turning in the Mediterranean Sea (when going west) or in the Indian Ocean (when going east) and would hence significantly blur the figures of this analysis. As a result, here it was chosen to focus on services which have been calling in both the North Range as well as at least one port of the following countries: China, South Korea, Japan. The table is thus reflecting the longest (and in volume terms most significant) routes of the Far East-Europe trade.
The analysis reveals that a round trip time of eight weeks was adopted as industry standard late in the nineties. In line with the rapidly surging Chinese container trade in the new millennium, the number of offered services has been increasing fast. Up to and including the year 2006, the standard round trip time has remained to be eight weeks. But faced with the increasing fuel prices and the somewhat relieved supply-demand balance of the years 2007-2008, the pattern seems to slide gently to the right, as the number of services with a round trip time of eight weeks is stagnating and slower services using nine vessels (and thus a round trip time of nine weeks) are on the rise.
In 2009 and the following years, this »gentle slide« turns into a massive landslide as carriers are struggling to keep the countless new container leviathans, which they either bought themselves or committed themselves to employing (due to long-lasting initial charter contracts) busy and are also faced with bunker prices stabilizing at the high level of ~600$/ton.
At the start of 2014, eleven weeks had become the new standard round trip time and not a single service was left using the former eight weeks. It is also worth noting, that the total number of weekly services has been reduced in response to the rapid increase of average vessel sizes on this trade lane (HANSA 09/2014, p. 112–114) while the trade itself grew rather anaemically since the recovery in 2010.
Transpacific
In the analysis of the Transpacific trade, lines calling in the »Far East« as well as in the Indian Ocean have been bundled together with the result that there seem to be two gravitation centres before the collapse of the market late in 2009.
The key segment certainly have been the Far East US West Coast services, focussing on round trip times of five weeks before the urge to keep the vessels running as fast as possible is reduced and six weeks is established as the new industry standard. The services connecting the US East Coast with Asia used to employ schedules featuring round trip times of eight weeks. But these have become a rarity today as the currently prevailing round voyages on these routes last up to eleven weeks.
Transatlantic
The transatlantic trade – being the shortest of the arterial trades – does not provide much potential for a large scaled optimization of voyage speeds. Historically, it seems that it has always been a tie between a round trip time of three or four weeks, with services running higher speeds managing to take over the lead at the start of 2005 and 2006 when the charter rates for the vessels typically found on this trade have been at high levels. But this process was reversed fast in 2009 and subsequent years. At the start of 2014, only one service was left using the once rather popular round trip time of three weeks. The new standard, used by roughly half of all services, today is four weeks, but the other half is going slower than that with one service regularly using seven weeks per round trip.
Who could have known?
Would it not be beautiful to have access to a time-machine every now and then? Not in order to know about next week’s lottery numbers but to every once in a while travel back in time and confront the shipping industry with some astonishing facts about the future? Who, in 2001 after the horrible attacks and the burst of the new economy bubble, would have guessed that the already very voluminous container shipping markets have been in for their most pronounced period of absolute and relative growth? Who, late in the nineties, could have imagined that in 2010 (and following years), bunkers would regularly cost 600$/t and that the global container trade would not implode as a result of that, but reach record levels on an annual basis instead?
And finally, who – just ten years ago, when container shipping just could not be done fast enough and the industry was having a hard time supplying the needed capacity for the demand growth – would have believed that today, container lines would be employing super, extra-, or even ultra-slow-steaming and that some industry participants probably secretly wish, they had ordered their container leviathans with the more economic engine option – instead of the faster one, since the economics of the liner shipping operation have been severely rearranged during the last ten years?
At the start of 2015, one of the key questions certainly is how carriers will respond to the significantly lower fuel prices and if they are actually inclined to speed some of their Far East-North Europe services up by cutting the round trip times for a week. The economic incentive is certainly there. But where to go with the extra capacity that this would release?
Michael Tasto


