Finanzen
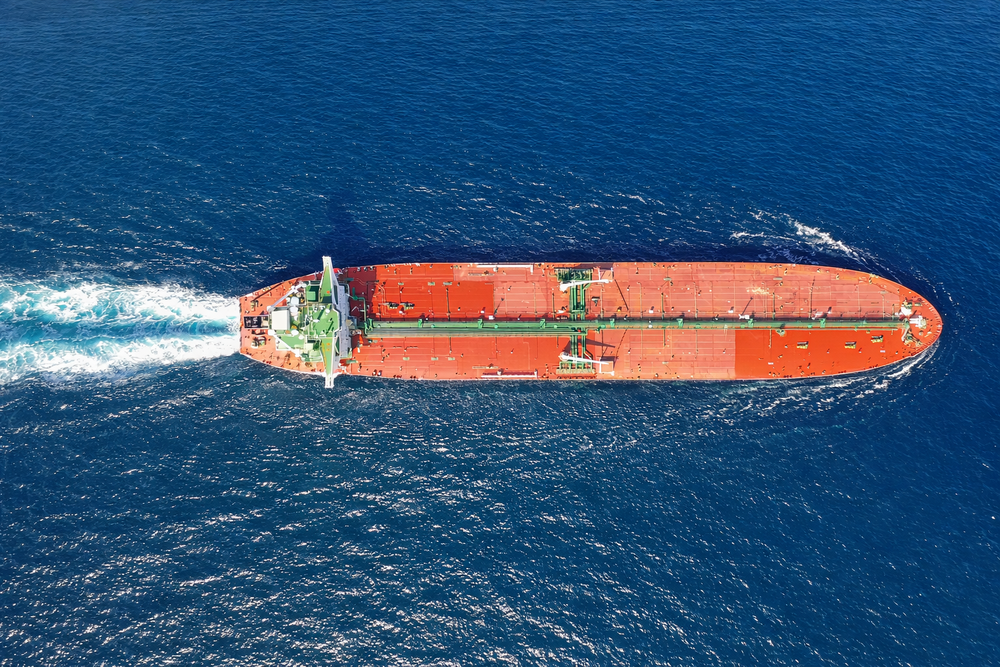
 China dominating bulker business

The top bulker trade route in 2019 was from Australia to China with 873,343,192mill. t of cargo moved. Brazil-China came in second at roughly …


Verwandte Themen
CMB.Tech schließt „Transformationsjahr“ mit 139 Mio. $ Gewinn ab
Der belgische Schifffahrtskonzern CMB.Tech der Familie Saverys hat für das Geschäftsjahr 2025 einen Nettogewinn von 139,1 Mio. $ ausgewiesen. Davon entfielen 89,1 Mio. $ auf das vierte Quartal.

Ceva macht nächste Projektlogistik-Übernahme perfekt
Die Logistik-Tochter der französischen Schifffahrtsgruppe CMA CGM, Ceva, darf alle Anteile der Fagioli Group übernehmen. Alle relevanten Behörden haben die Übernahme des Projektlogistikers abgesegnet.
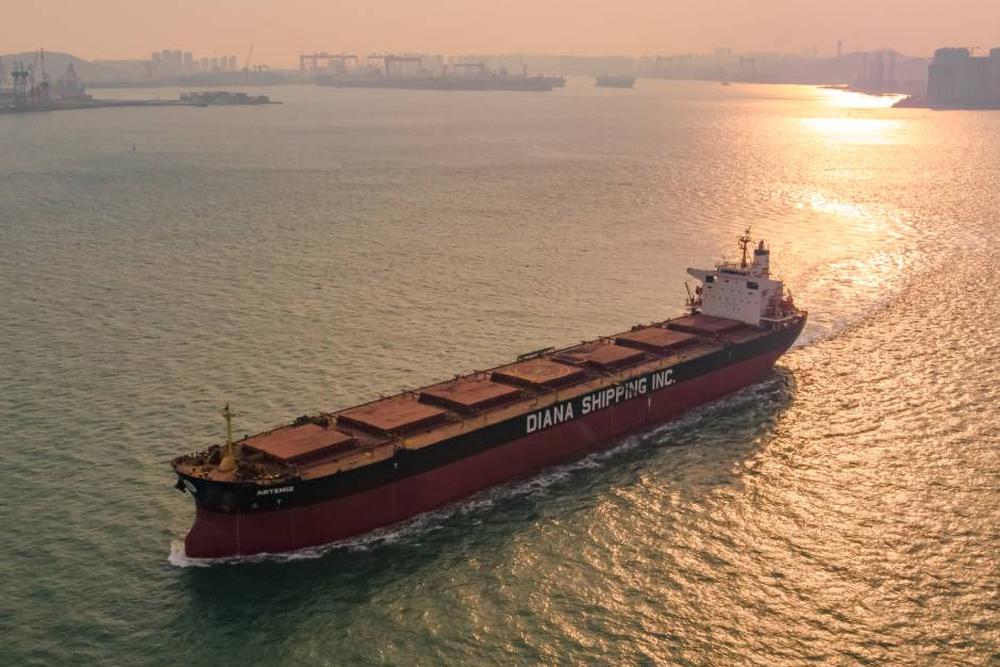
Dry-Bulk-Konsolidierung: Genco wehrt sich gegen Vorstoß von Diana
Die Bulkreederei Genco wehrt sich erneut gegen einen Übernahmevorstoß von Diana Shipping, der Teil einer forcierten Konsolidierung im Dry-Bulk-Segment ist.
Weitere Themen

Daily & Breaking News
Wir liefern werktäglich aktuelle Schlagzeilen und Updates.