Simulation-driven design can be a complementary approach for ship modelling, as this article shows which is based on a paper on the occasion of COMPIT 2011.
1. Introduction
The aim of this article is to demonstrate, by means of an example application to a[ds_preview] mega-yacht, how numerical simulation can be used to explore the design-space early in the concept design stage of a project and how this information may be used to gain deeper insight into the design compromises which will have to be made.
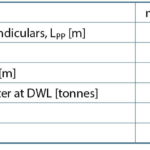
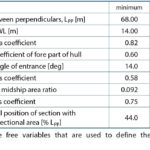
Table I shows the principle particulars of the proposed vessel; these would typically be given by the client: »Design me a mega-yacht that’s a bit faster, a bit bigger and a bit more luxurious than the one I bought last year!« As can be seen, the design requirements are quite vague, so it is of utmost importance to gain an understanding of the design-space in which the solution will lie (or even to ascertain the feasibility of the proposal).
1.1 Gain of knowledge
Information is power! Prior knowledge of the relevant design-space for a ship-design project enables the design team to achieve a sensible compromise that meets the customer’s requirements. This knowledge can be gained in several ways. For example, an existing vessel may serve as a basis design from which a new, improved vessel that better fulfils the customer’s requirements can be derived. Or, if there is little prior knowledge or the project requires a completely novel vessel design, then it is important for the designer to gain an understanding of the design-space by some other means. To summarise, the proposed approach might be used to:
• gain an insight of the design-space early in the project;
• enable rapid prototyping of ideas for novel design solutions;
• provide data for decision support for possible design changes required to achieve desired performance; and
• anticipate consequences of requested design changes.
1.2 Concepts and methodology
The example presented serves to illustrate the concepts and methodology. However, there is no reason why different design aspects could not be examined or different numerical tools used. The key is being able to automatically vary the proposed vessel in a manner so as to produce viable variants and then be able to predict the variants’ performance characteristics pertinent to the design requirements.
The design-space investigation thus comprises three main tasks:
1. Definition of a suitable parametric model which can be used to generate feasible design variants from a small number of key parameters.
2. Numerical analysis of the vessel using simulation tools which can provide an assessment of the vessel performance characteristics of interest (in this case, hydrostatics, resistance and sea-keeping). These tools need to be selected so that they can provide sufficiently reliable data within available time and computational resource constraints.
3. Automation of vessel design variation, analysis, results gathering and post-processing tasks.
The Friendship-Framework (FFW – Friendship Systems, 2009) is used to firstly define the hull geometry in a parametric manner which can then be systematically varied and secondly to systematically vary the design, control the analyses and collate the results for all the design variants.
1.3 What is important?
What is of interest and importance to the designer will depend on the individual project being undertaken. In this example, static stability as well as resistance and also passenger comfort when the vessel is under the influence of waves are considered.
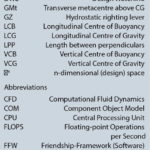
The vessel’s calm water resistance was estimated using Shipflow (Flowtech 2004, 2009), whilst sea-keeping characteristics and hydrostatic stability were predicted using Seakeeper (SK) and Hydromax (HM – Formation Design Systems, 2011).
1.4 Computer hardware
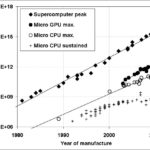
It is interesting to look at the increase in computer performance over time; this is shown in Fig. 1 for the last 30 years (Supercomputer 2011; Thibault et al. 2009; Koomey et al. 2009). It can be seen that there continues to be exponential growth in not only the performance of supercomputers but also that of personal micro-computers. What is also interesting is the application of GPUs rather than CPUs to solving CFD flows (Thibault et al. 2009). GPUs can be optimised for floating-point calculations and matrix inversion much more than CPUs (which are required to perform a much broader range of operations). It can be seen that the rate of increase in performance of GPUs is greater than that of both CPUs and Supercomputers.
The rapid development of hardware and the advent of computer clusters and clouds (e.g. Amazon Elastic Compute Cloud – EC2) and other distributed systems mean that the hardware resources necessary for the type of numerical investigations described in this article are now accessible to even the smallest design teams.
2. Methodology of the investigation
In this section, we shall look in some detail at the numerical method used for the design-space investigation. The key concept to take from this paper is the methodology; different analysis software can be substituted and different performance measures will be appropriate for different projects.
2.1 Parametric modelling
The general hull-form chosen for the example mega-yacht was a classical twin-screw design with bulbous bow and skeg. Appendages were not included at this initial phase of the design. The bulb was modelled in some detail, since it had a significant impact on the hull resistance. The bulb was blended into the main hull over a region of transition aft of the forward perpendicular. The main hull itself was split into fore- and aft-body regions joined at the section with maximum cross-sectional area. A full 3D model of this geometry was realised in the FFW.
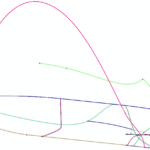
The model was parameterised so the geometry could be manipulated by a small number of key features which the designer would wish to vary. These parameters are the free-variables of the n-dimensional design-space to be investigated and were used to generate design variants within that space. The parameters (or free-variables), with their range of variation, are given in Table II and the primary curves describing the model are shown in Fig. 2. The body plan, plan, profile and perspective views of a representative instance of the parametric model are shown in Fig. 3. Full details of the parametric model are described in Harries (2010).
2.2 Performance prediction
The numerical tools used to calculate the vessel performance are described below. The tools presented cover three of the main areas of interest during initial design: resistance, sea-keeping and static stability. However it would be entirely feasible to include other tools to compute other performance parameters, for example production cost, manoeuvring etc. The scope of the performance parameters to be considered depends on the time available to complete the study as well as the tools available and the level of detail of the ship model required to produce meaningful results.
2.2.1 Flow simulation and resistance prediction
When predicting calm-water resistance, there is generally a trade-off between accuracy and the computational effort required. Since only the bare hull was modelled, it was considered appropriate to employ potential flow theory to solve the non-linear wave resistance problem with free sinkage and trim combined with a thin boundary layer theory calculation for the frictional resistance, further details are given in Harries (2010). When fine-tuning appendages, such as brackets, later in the design, a RANSE calculation should be undertaken to accurately capture the viscous phenomena, for example Brenner (2008).
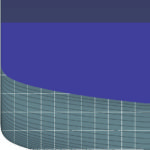
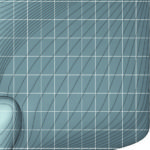
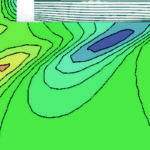
The flow simulations were computed on a standard dual core notebook and took about four to five minutes per variant and speed. With a CFD license for both cores, around 200 designs could be computed in one overnight job. A typical panel arrangement and results are shown in Fig. 4.
2.2.2 Motions in waves and comfort measures
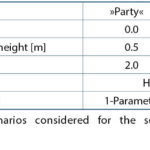
The vessel motions due to waves were predicted using Seakeeper – a linear strip theory method in the vein of Salvesen et al. (1970). Two scenarios were considered (details are given in Table III):
1. Vessel at anchor or in a marina in a very slight sea-state – the so-called »Party« condition (note that mooring forces were not considered).
2. Vessel underway at a cruising speed of 16 kts in a higher sea-state, as might be encountered when traveling between two such »Party« locations – the »Cruise« condition.
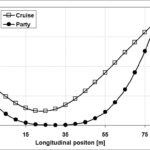
The motion sickness incidence (MSI) after two hours exposure was computed at different longitudinal positions along the length of the vessel (Fig. 5). That is the percentage of people who can be expected to vomit after having been subjected to the motions for a period of two hours, as calculated by the method proposed by O’Hanlon and McCauley (1974) and McCauley et al. (1976). The performance measure extracted from the analysis was simply the minimum MSI along the length of the vessel for each of the two scenarios considered; assuming that the vessel layout could be adjusted so that MSI-critical systems (e.g. the bar) could be sited accordingly.
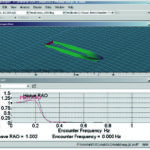
The sea-keeping model used 41 equally spaced sections through the hull. Conformal mapping was used to model the sections and compute the sectional added mass and damping in heave (five mapping terms were used to give a good fit to the hull sections). The vessel heave and pitch response amplitude operators (RAOs) was then calculated at 200 frequencies and these were used to calculate the MSI. The calculations, for 200 variants, were computed on an average desktop computer using SK, again in an overnight job controlled by the FFW.
2.2.3 Hydrostatic stability criteria
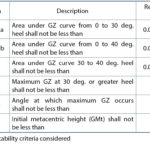
Virtually all vessels must comply with hydrostatic stability criteria specified by class. A small subset of intact-vessel stability criteria, which are typically applied to this class of vessel, were selected from the Large Commercial Yacht Code (Maritime and Coastguard Agency 2007) intact stability standards for monohull vessels, section 11.2.1.1. These criteria are summarized in Table IV.
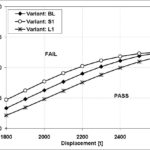
In order to obtain a meaningful performance measure of stability, the maximum vertical centre of gravity (VCG) at which all criteria were just passed was calculated for a range of displacements. A typical curve of maximum allowable VCG against displacement, for three representative design variants, is shown in Fig. 6. The measure of performance used was the area under the maximum allowable VCG curve integrated over the displacement range of 1,800 t to 2,600 t. This measure was chosen because early in the design process, neither the VCG nor the displacement would be known with certainty; the measure gives some indication of the scope of VCG change that can be accommodated whilst still passing the criteria.
Damage stability has not been considered at this stage because this would depend on the compartmentation layout which would not be available early in the initial design. Once a design variant has been selected for detailed design development, the internal layout and compartmentation would have to be chosen so that damage stability requirements were met.
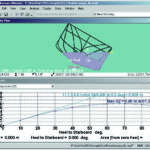
The analysis was performed in HM using a range of heel angles at each displacement to calculate the GZ curve for a given VCG. The vessel was free-to-trim ensuring a longitudinal balance of CG and CB (the LCG being derived from the LCB of the upright vessel). The VCG was then systematically varied to determine the maximum value of VCG at which all the stability criteria were still passed. Managed by the FFW, the calculations, for 200 variants, were computed in a matter of several hours.
2.3 Software integration
The FFW and the simulation software are developed by different software vendors. However, in order to automate the task of generating design variants and analyzing their performance, it is essential that the software systems are able to communicate. Under Microsoft Windows there exists a paradigm for inter-process communication. This is known as the Component Object Model (COM). For full details of COM, the interested reader is referred to Box (1998). COM allows access to suitably COM-enabled applications via a common interface from a variety of programming languages: C#, VBA, etc. and also the FFW’s own macro language.
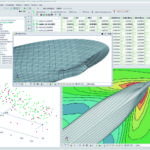
Suitable macros were developed in the FFW to export the hull geometry and then import this geometry and run the analyses in HM and SK. The results of the analyses were then read back into the FFW for post-processing to calculate the final performance measures for each variant. Fig. 7 shows a screenshot of the FFW, HM and SK in action.
2.4 Design of experiments
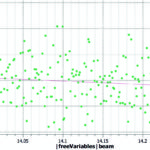
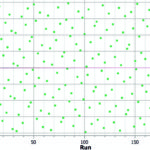
The design-space was investigated using a »Design of Experiments« approach to populate the domain with variants. The principal particulars of the vessel are given in Table I and the nine free-variable which were used to define the variants are given in Table II. These nine free-variable thus establish a nine-dimensional space 9. A Sobol algorithm, Press et al. (2007), was used to give a quasi-random, yet uniform sampling of these variables over the desired range (see Table II). The performance was calculated for 200 variants. A typical distribution of variants (for one free-variable) is shown in Fig. 8; as expected, the Sobol algorithm provides a uniform, quasi-random sampling over the design-space. The design of experiments approach covers the design-space more economically than a regular grid approach – a regular grid of just two parameter variations in nine dimensions would require 512 (29) variants.
2.5 Response surfaces
The design-space exploration generates a large quantity of data and represents a not insignificant amount of computational effort (especially if sophisticated numerical simulation tools have been used). It is useful then, to reuse this data, potentially for automated optimisation or other similar applications. There are several ways in which this data can be captured so as to be able to determine the vessel performance measures for a set of specified values of the free-variables. These include: statistical regression; artificial neural networks (e.g. Couser, 2004) and response surfaces. All of these methods effectively allow interpolation of the performance measures of the design given a set of values of the design parameters (free-variables) without having to redo the numerical simulation, thus saving a lot of computational effort.
Following the work of Harries (2010) a response surface, meta-model method has been used. The n-dimensional (where n is the number of free-variables) response surfaces for the performance measures are fitted using a Kriging approach, see Tillig (2010). Once the response surface has been generated, interpolation is more or less instantaneous (compared with a CFD or sea-keeping calculation which might take a few minutes to several hours to perform). Continuous iso-parametric curves and surfaces can then be generated from the response surface making it easier for the designer to visualise the design space: the designer is able to see the effect of continuously varying one or two free-variables rather than seeing discrete results for variants where all the free-variables have been modified (which is the raw output from the design of experiments investigation of the design-space).
3. Results
This section presents some results for the mega-yacht example. One should not forget that these findings are only meaningful in the context of the chosen parametric model (the established design-space) and that they rely on the validity of the simulations. Even though these simulations are built on first principles, there are notable simplifications, for instance the wave resistance and sea-keeping analyses, as used in this example, ignore viscosity.
3.2 Correlations
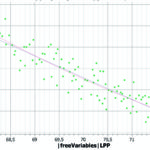
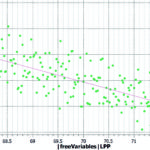
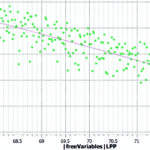
Some samples of the raw results from the Sobol investigation of the design-space are presented by means of correlation plots (as shown in Figs. 9 to 14). These correlation plots can highlight general trends in the data but it should be noted that the points represent discrete variants where all of the free-variables have changed; thus these diagrams do not accurately represent the continuous variation of a single variable. The band-width of the scatter of points about the mean line gives an appreciation of the difference that can be achieved due to variation of all the other free-variables. It should be noted that even when there is reasonably strong correlation between performance and a free-variable, there is often a significant range of performance (which thus depends on the other free-variables). For example, in Fig. 11, at a length of 70 m the Cruise MSI can vary between 4 % and 5 %. This also implies that there is always room for improvement even though one (or several) free-variables need to be fixed at a certain point in the design process. The range of performance can be taken as an initial indication of how much potential for optimisation is available.
3.2.1 Principal hull geometry
Fig. 9 presents the vessel displacement against the length between perpendiculars. A general trend towards higher displacement for longer vessels can be seen. Nevertheless, as discussed above, there are instances of vessels with higher and lower displacements (for a fixed LPP) that depend on the values of the remaining free-variables.
3.2.2 Calm water resistance
Fig. 10 shows the correlation between vessel length and predicted wave resistance coefficient. As might be expected the longer the vessel, the lower the resistance. The interested reader is referred to Harries (2010) for further details and results of the resistance calculations performed.
3.2.3 Sea-keeping
As might be expected, the MSI shows a reasonably strong inverse correlation to the vessel length: as the vessel length increases, the motion sickness incidence decreases (Fig. 11). Sometimes it may be found that there are surprising correlations (or lack thereof); for example Fig. 12 shows that the correlation between MSI and beam is not very strong, contrary to what might be expected.
3.2.4 Hydrostatic stability criteria
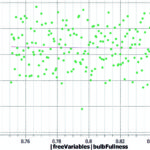
A strong inverse correlation between vessel length and stability was found (Fig. 13). This is probably due to the fact that the displacement range for the stability calculations was fixed irrespective of vessel length. Shorter vessels would be broader and/or deeper in the water generally resulting in greater intact stability (up to the angles of heel investigated). Other parameters showed little or no influence on stability (Fig. 14) indicating that they can be varied to improve other performance measures without penalising the stability performance.
3.3 Response surfaces
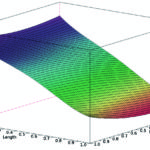
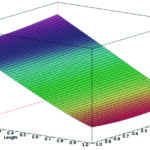
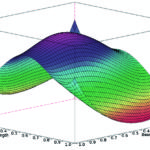
Once the n-dimensional response surfaces have been fitted to the discrete data obtained from the design-space exploration, continuous iso-parametric curves and surfaces can be generated for continuous variation of only one or two free-variables (the others remaining constant). In Figures. 15 to 17, all but two free-variables are kept constant, resulting in iso-surfaces through the design space. In each diagram the range of each free-variable has been normalised to 1.0.
In most cases the response surfaces follow what might be expected: Fig. 15 shows that the delivered power requirement is reduced for longer and generally narrower vessels; and Fig. 16 shows that MSI is reduced for longer vessels, with the optimum beam being about the middle of the range. However, in the case of the stability performance measure response surface (Fig. 17) the effects of length and beam are more complex. It should be noted that since the entire design-space exploration is not covered by the variants tested, care should be taken to ensure that the response surface is used for interpolation, and not extrapolation. The sharply raised corners in Fig. 17 are due to extrapolation with insufficient variants to adequately describe the response surface in these regions.
4. Taking things further and practical application
In this article we have presented an example using a mega-yacht initial design project. Relatively simple numerical simulation tools have been used to investigate three aspects of the design process: calm-water resistance (using potential flow and boundary layer theory), sea-keeping (using strip-theory) and static stability. However, there is no reason why the same methodology cannot be applied to different problems using different simulation tools.
The Friendship-Framework is very useful in that it facilitates a parametric model of the hull geometry and allows this geometry to be systematically varied. It then manages sending the geometry to and retrieving the results from the external simulation tools. The COM interface provides a relatively simple mechanism for inter-process communication on the Microsoft Windows platform (the coupling between the FFW and the analysis software, SK and HM, was achieved using COM).
Although not presented in the current work, using the resulting response surfaces to drive an optimisation search is entirely possible and would be the logical next step of the design process (see Harries 2010 for an example).
5. Conclusions
One of the most challenging tasks for the ship designer is to gain an insight into the non-linear relationships between competing objectives, constraints, free- and dependent-variables so as to be able to obtain a suitable final design that meets the customer’s requirements. The methodology described in this article shows how first-principles simulations, coupled with a parametric model of the vessel can facilitate rapid exploration of the design-space. The methodology can be summarised as follows:
4. Creation of a suitable parametric model of the vessel. The parameters chosen to be free-variables entirely define the vessel and span the design-space of interest. They can be regarded as the free-variables of an optimisation problem.
5. Performance measures and constraints such as hydrostatics and hydrodynamic performance are identified and determined by means of numerical simulations based on the vessel obtained from the parametric model.
6. The design-space is then systematically and automatically explored using formal methods.
7. The results of the design-space exploration are captured by response surfaces that allow for very rapid interpolation of the performance measures for any set of values of the free-variables.
8. Once the design-space is known and understood, the data can be used to answer »what if?« type questions as well enabling optimisation searches to be performed quickly.
The key things to take from this article is the methodology. The details of the specific parametric model and analysis tools used are of less importance because they can (and should) be adapted and tailored to the specific needs of the individual project. However, what this article was aimed to show is how an in-depth knowledge of the design-space in which one finds oneself can be gained by more formal and extended use of numerical simulation. Of course, as computational power continues to increase and the accuracy of numerical simulation techniques continues to improve, it will be appropriate to change the hardware and software used to perform the design-space exploration. It is believed by the authors that the approach described in this article will aid naval architects during their design tasks by providing familiarity with novel design ideas more quickly and allowing them to make appropriate design modifications to match evolving client requirements more easily.
Patrick Couser, Stefan Harries, Fabian Tillig


