A statement in favour of a wider range of measurement procedures, most of all the spiral manoeuvre.
Regarding the assessment of the manoeuvring performance of ships in open waters the International Maritime Organization (IMO) mainly concentrates on[ds_preview] the 1st and 2nd overshoot angles of the 10°/10° zigzag manoeuvre. The author recently showed in several papers that the recommended criteria dependent on the length speed ratio L/V are physically unreliable. More suitable are parameters of the so-called spiral test like the slope of the rc-curve at zero rudder angle and the critical rudder angle width in case of yaw instability. However, it is also shown that a correlation between these parameters and the 1st overshoot angle of the 10°/10° zigzag manoeuvre can be derived.
Furthermore, results of a regression analysis for several important linear derivatives of the most widely used equations of motion are presented. This is obviously not a new idea because already realized by several authors. However, the novelty is a strict separation between single-screw freighters and bulk carriers, single-screw container carriers, and twin-screw passenger vessels, respectively. Moreover, not only derivatives of sway and yaw motions were considered but also the corresponding components of the roll motion were regressed and verified.
Additionally, results of a study regarding the influence of the helm rate on the 1st overshoot angle during the 10°/10° zigzag manoeuvre are introduced.
1. Introduction
For some considerable time the author has been engaged in the assessment of the manoeuvring performance of merchant ships. Along with it he critically observed the manoeuvring standards presented by the International Maritime Organization (IMO), Oltmann (1996, 1998). Another supplemental field of interest was the regression analysis for the most important linear derivatives of the equations of manoeuvring motion, Oltmann (2003, 2005). Within the present paper the main experiences and findings on both domains during the recent past are summarized and suitably analyzed.
A familiarity with the main standard ship manoeuvres and the respective parameters is presumed. Also a basic knowledge of the mathematical presentation of ship manoeuvres is helpful. As far as possible ITTC standard symbols are used. Alternative symbols are explicitly defined in the text.
2. Distinct Approach
In the present paper the main interest is directed to the yaw stability and course-keeping performance of ships. The turning ability and the stopping performance are adequately covered by the given standards of IMO (2002). Therefore, no further discussion seems necessary.
In the centre of interest is the 1st overshoot angle of the 10°/10° zigzag manoeuvre. According to IMO this overshoot angle should not exceed
• 10 deg, if Lpp/V0 < 10 sec,
• 20 deg, if Lpp/V0 30 sec,
• (5 + 0.5 · Lpp/V0) deg, if Lpp/V0 10 sec but < 30 sec,
Lpp and V0 are expressed in »m« and »m/sec«, respectively.
The author repeatedly hinted at the fact that this limiting line does not conform to the physical reality, e.g. Oltmann (1996, 1998).
Which alternatives are conceivable? One choice is the so-called stability lever
(1)
which can be considered as a relationship between the lever arm of forces due to yawing and swaying. It is indicating whether or not the vessel is stable in yaw but not giving a quantitative measure, see also Crane et al. (1989). In particular this holds when the roll motion has to be considered, too.
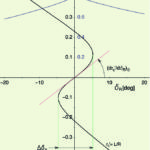
A much better option are results from the commonly named spiral test, whose main outcome is the dependency of the constant yaw rate rc on the matching rudder angle R. In Fig. 1 the characteristic results for a modern container vessel are presented. It shows the non-dimensional constant yaw rate rc’ and the corresponding along-track velocity Uc/U0 as functions of rudder angle R.
There are two parameters that are meaningful for the reverse spiral test. First, the width of the unstable loop R and second, the slope of rc’ at the origin (drc’/d R)0. The advantage of the latter is that it can be explicitly calculated provided the main linear coefficients of the equations of motion are available.
Equation (2) reproduces the slope in the case of planar motions (three degrees of freedom, 3DF).
(2)
Compared with Eq. (1) it can be noticed that in Eq. (2) also the rudder coefficients Y ’ (side force) and N ’ (yawing moment) are required for the prediction. This means that possibly such rudder coefficients can be evaluated which are necessary to reach a definite slope.
With that it holds
(3)
Usually Eq. (2) is valid only for normal freighters and bulk carriers, respectively. Regarding container and passenger vessels it looks completely different. Here also the roll motion plays an important role (4DF). In that case the following system of three linear algebraic equations has to be solved, see also Haarhoff and Sharma (2000).
For Eq. (4) see box. (4)
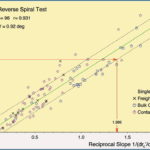
How to proceed? The present data of our manoeuvring data base show a pronounced linear correlation between the two spiral test parameters mentioned. Fig. 2 presents the width of the unstable loop R versus the reciprocal slope 1/(drc’/d R)0. The 96 sets of test data represent different single-screw, single-rudder freighters, bulk carriers, and container vessels, some of them at different speeds, all being dynamically unstable in yaw. Apart from the number of data n Fig. 2 also gives the standard deviation and the correlation factor r. The value of r lies between -1 and +1. It takes on a value of 1 when the data points lie on a perfect straight line with positive slope. The value of 1 holds independent of the magnitude of the slope. For more details see Press et al. (1992).
For a meaningful assessment of yaw stability and course-keeping performance a restriction of the unstable loop R should be recommended. A plausible effective value is 7 deg, which as well is favoured by Yamada (2003). It can be seen from Fig. 2 that the proposed limit of 7 deg belongs to a reciprocal non-dimensional slope value of 1.386. This means 0.721 for the original slope. If possible, actual slopes should always be larger than this limit.
Due to the fact that the effort to conduct a spiral test is very great, the 10°/10° zigzag manoeuvre should not entirely be damned. Especially because compared to a spiral test its performance is a lot easier. Before a correlation between main parameters of the spiral test and the 10°/10° zigzag manoeuvre is presented it has to be pointed to some secondary conditions during all zigzag manoeuvres performed and simulated, respectively. These are
• helm rate 2.50 deg/sec (full-scale),
• time lag of rudder plant 2.0 sec (full-scale), and
• initial turn to starboard.
This guarantees that the zigzag manoeuvres are mutually comparable.
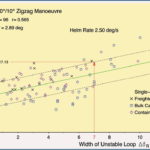
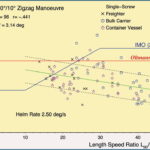
Fig. 3 presents the 1st overshoot angle of Z 10°/10° versus the unstable loop width R (spiral test). Compared with Fig. 2 the data show a larger scatter. However, a clear trend is evident. Now proceeding from R = 7 deg and allowing a standard deviation of = 2.9 deg a critical overshoot angle of 17.1 deg is reached. Therefore, the author similar to the 20°/20° zigzag manoeuvre suggests a constant limiting value of 17 deg, see Fig. 4. It shows the actual limiting line of IMO (2002) as well as the author’s proposal, Oltmann (2009), in dependency upon the length speed ratio Lpp/V0. Beyond that the figure presents the data of the 96 zigzag manoeuvres investigated from our manoeuvring data base. It can be seen that the 1st overshoot angles decrease with increasing length speed ratio and decreasing speed, respectively.
Against this the IMO line gives an opposite trend meaning that it is obviously unreasonable. In particular, the range of 10 sec Lpp/V0 20 sec is entirely confusing.
3. Coefficient estimation
3.1 Regression analysis
In Chapter 2 two proposals regarding the assessment of yaw stability and course-keeping performance are given. These are
• first preferably, the slope of the spiral curve at origin, rc = 0, and
• secondly, the 1st overshoot angle of the 10°/10° zigzag manoeuvre.
What measures for an identification of the hydrodynamic coefficients within Eqs. (2) and (4) are available? These are
• model tests with captive ship models,
• CFD calculations, and
• estimations based on regression equations.
The latter procedure is advantageous as far as it can be performed quickly at low costs.
In a recent study the author developed revised regression formulas for four different ship types and three different aft body configurations, Oltmann (2009). The ship types are as follows
• single-screw freighters with CB < 0.775,
• single-screw bulk carriers with
CB 0.775,
• single-screw container vessels, and
• twin-screw passenger vessels.
The aft body configurations reach from stern till
• aft shoulder,
• parallel mid-body, and
• main frame.
The number of coefficients per equation was restricted to six.
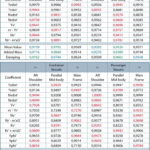
Because it is impossible to reproduce all equations with their respective coefficients only a table with all correlation factors from the comparison between estimated and given values of the data base is presented, Table 1. In addition Fig. 5 shows the distribution of all red marked correlation factors. It can be seen that nearly 60 per cent of all correlation factors are larger than 0.95. Only two factors are smaller than 0.80.
3.2 Example
To show the possibilities of the regression analysis performed a typical recently designed bulk carrier was chosen. It is the so-called KVLCC1 project, introduced by the Maritime and Ocean Engineering Research Institute (MOERI). The vessel already was subject of several investigations, e.g. see the Workshop of Verification and Validation of Ship Manoeuvring Simulation Methods, SIMMAN 2008.
The results of the estimations are summarized in Table 2. On top of the table information about the project, the main dimensions as well as some statistical parameters are presented. After that the mean values of added mass coefficients are given. These are followed by the main damping coefficients, which together with the available rudder coefficients enable the determination of the spiral curve slope according to Eq. (2). Apart from the mean values also the related standard deviations are shown. The latter are important for an estimation of the possible margins of error. The mean value of the spiral slope is presented in the last but two lines. The reciprocal value is given in brackets. In the next line the calculated errors are outlined, assuming a probability of 50 %. From the values in brackets it can be seen that even the worst case, the reciprocal slope of 0.651 is obviously smaller than the proposed standard limit of 1.386.
Regarding the determination of the margins of error the Gaussian error propagation method was applied. It reads
(5).
More details for example are given by Zurmühl (1965).
Within the developed estimation programs additionally a plausibility control is introduced. This actually means that all relevant hull parameters of the test ship are checked with regard to their relation to the corresponding values of the data base. If some parameters are found outside the data base bandwidth, the estimation has to be watched with care. In the present example all hull parameters required are not placed beyond the given limits.
What measures are conceivable for an improvement of yaw stability and course-keeping performance? The greatest possibility is an alteration of rudder force and moment. If this measure is not adequate to fulfil the proposed standards, a fitting of additional fins and / or skegs should be kept in mind, e.g. Oltmann (2004).
4. Helm rate effect
Within the proposed regulations of IMO (2002) a necessary helm rate of the rudder plant is not submitted. This is a deficiency as far as a fair comparison between different ships with different helm rates can not be ensured. In the present study a mean helm rate of 2.50 deg/s was introduced which is slightly larger than the minimum value of 2.32 deg/s proposed by several classification societies.
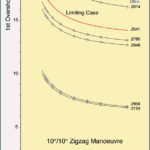
In order to determine the effect of a helm rate modification on the 1st overshoot angle (10°/10° zigzag), several series of simulations for different types of ship (freighters, bulk carriers, and container vessels) were carried out. During the simulations the helm rates varied between 2.32 and 10.0 deg/s, respectively. The results for the container vessels are documented in Fig. 6. It shows a clear decrease of the overshoot angle with increasing helm rates.
Following Bronstein and Semendjajew (1969) the data lines can be described by means of a linear fractional transformation
(6)
To fit the data first a fixed point (x1,y1) has to be chosen. In the present case a suitable point belongs to x1 = 2.5 deg/s. The final fit is accomplished with
(7)
in combination with x.
Y can be described by following linear function
(8)
Therefore only A and B have to be determined. This yields
(9)
In the present case B is equal to zero and A is negative. Hence, Eq. (9) can be modified as follows
(10)
A limiting line for the most interesting basic case of x1 = 2.50 deg/s and y1 = 17.0 deg can be obtained by interpolation, see the red curve in Fig. 6. What does this line mean for practical purposes? It indicates that all data underneath this line fulfil the standard proposed.
In Table 3 the limiting values for the types of ship investigated are listed. The table shows that the results for the bulk carriers and the container vessels are practically identical.
5. Conclusions
Regarding an assessment of the yaw stability and course-keeping performance of a ship the author clearly favours the spiral manoeuvre and its slope of rc’= f( R) at origin. Main reason is that the slope is an objective characteristic which is explicitly calculable. However, the 1st overshoot angle of the 10°/10° zigzag manoeuvre, especially during full-scale trials, is often influenced by external incidents (wind, current, improper conduction, power of rudder plant).
For a first check during the design stage the introduced regression equations can be applied. In case of any doubt additionally CFD calculations and/or model tests with free-running or captive ship models are required, see Oltmann (2005).
The regulations of IMO should not be treated dogmatically. Therefore, it is desirable that not only IMO but also the responsible national institutions, like the German Federal Ministry of Transport, Building and Urban Development, could consider a review of the main manoeuvring standards.
Author:
Dr.-Ing. Peter Oltmann
Former Chairman of the STG Committee »Manoeuvring«
Peter Oltmann


