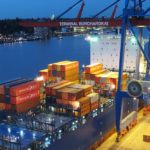
Vessels with up to 8,000 TEU will be able to reach the main commercial port of Namibia when the constructions works are finished. Recently, an EIA study has been completed which shows that the potential environmental impacts of the new terminals are acceptable
1 Plans to cater for growth of container throughput at Port of Walvis Bay
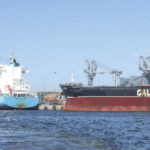
Port of Walvis Bay[ds_preview], the main commercial port of Namibia, has presently two berths with a maximum water depth of -12.8 m CD (composite depth) for container vessels up to 3,500 TEU (Panamax) available. The container market at Walvis Bay has made excellent progress over the past years with very good perspectives for the future through reliable and quick services and an efficient port management.
Besides boosting intercontinental container transhipment volumes at Walvis Bay, the throughput of container volumes from landlocked countries in southern and central Africa (30 % of traffic) as well as from transhipment to other West African countries (60 %) is expected to grow. The continuing trend of increasing container vessel sizes servicing as main liners requires larger water depths in the port and access channel.
Moreover, the Namibian Port Authority (Namport) recognised that the existing container stacking areas have reached full capacity by 2011 with no further possibility for expansion.
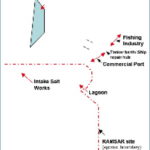
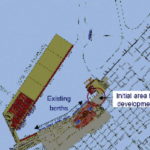
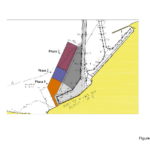
The initial plan to implement new container facilities along the existing quay line revealed to be extremely difficult due to conflicts of various activities and expansion plans in the already congested area (see Figure 1.2). Subsequent to a pre-feasibility study [2] Namport had therefore initiated a full feasibility study [3] to investigate a new container terminal on reclaimed land connected to shore by a causeway. The implementation of the new terminal is planned in three phases (Figure 1.2).
• Phase 1 (length 550 m) up to 5,000 TEU vessels: 2012 (commission date)
• Phase 2 (add. 550 m) up to 8,000 TEU vessels: 2015 (commission date)
• Phase 3 (add. 1200 m) up to 8,000 TEU vessels: open (long term expansion)
The terminals will be 500 m wide. Container handling is envisaged by ship to shore cranes (STS) operating from a deck on piles quay structure. Following [3] Phase 1 of the extension project is economically viable. To mitigate imbalanced high dredging cost in the early project stage the required navigational areas had to be minimized by nautical simulations [1].
The 5,000 TEU vessels considered in Phase 1 have a maximum beam of 32 m (Panamax), so that only the nautical depth of the existing access channel needs to be extended. In the port basin a larger turning circle is required between the Phase 1 terminal and the existing berths (marked light grey in Figure 1.3). In the later development phases the (dark grey) areas shall be subsequently dredged to the required nautical depths.
The proposed container terminal development involves extensive land reclamation and dredging activities adjacent to Walvis Bay lagoon (Figure 2.1) – an environmentally protected Ramsar site (international convention on protection of important wetlands, Iran 1971). A comprehensive environmental impact assessment (EIA) was required to evaluate potential adverse effects of the new container terminal on the Walvis Bay environment and to investigate measures to mitigate such effects to an acceptable level.
Delta Marine Consultants (DMC, The Netherlands) was responsible for the project management and coordination of the EIA and, in particular, for the entire numerical modelling of the coastal processes including the optimization of the dredging and reclamation strategies.
The numerical modelling of the coastal processes included:
• Tidal and wind induced flow pattern
• Analysis of offshore waves and modelling the wave transformation into the bay and lagoon
• Water exchange between bay and lagoon
• Sediment transport in the bay
• Spread of dredging and reclamation plumes in the bay and lagoon
• Water exchange in the future port basin and spread of effluents from fish processing plants
The formal EIA process comprising the potential impact from noise emissions and traffic during construction and operation, the effects on marine ecology and socio-economic impacts as well as the nautical modelling was covered by the consortium partner, Council for Scientific and Industrial Research (CSIR, South Africa).
Based on the comparison of the modelling results for the existing situation (without port extension) and the future development phases the impact on various envi-
ronmental parameters (e.g. water levels, flow velocities, waves, sediment transport) has been assessed. Potential mitigation measures included modifications to the terminal footprint, optimization of the lagoon entrance as well as optimized reclamation methods to reduce spread of fines.
During the initial assessment of the envisaged terminal footprint it was proposed to move the causeway in northeast direction (along the existing quay line (refer to Figure 1.3) in order to:
• increase the distance of the causeway/ terminal from the lagoon entrance to reduce potential negative hydrodynamic effects on tidal flow
• utilize the available port areas more efficiently and to improve the road and rail access towards the new terminals
• increase the distance of the causeway/ terminal from the planned adjacent marina development
The shifting of the causeway and consequent re-orientation of the terminal was agreed by Namport as base line for the scope of the study.
2 Walvis Bay environment
2.1.1 Bay and lagoon
Walvis Bay has a most fascinating landscape attracting a growing number of tourists every year. Walvis Bay is protected from the open sea by a large peninsula formed by littoral drift, with Pelican Point lighthouse situated at the spit (Figure 2.1). The peninsula is growing at a rate of 15 m/year. The water depth near the mouth of the bay reaches about -20 m CD reducing to -2 m CD at the lagoon entrance. Nutrients originating from the Benguela current are flushed into Walvis Bay by tidal currents creating an important feeding ground at the intertidal flats for smaller organism, shellfish and migrating birds [1]. The turbidity of the water is considerably larger in the lagoon than in the more northern areas of Walvis Bay.
The lagoon has been formed by an earlier branch of the Kuiseb River which did not discharge water to the sea for the past decades. The lagoon is a dynamic system driven by the sediment balance and the water exchange with the outer bay through the 500 m wide entrance channel. Since vegetation outside the urban areas is scarce or absent, a substantial fraction of sand is brought into the system by aeolian transport from the adjacent desert. The lagoon entrance has been partially dredged in the past to enhance water exchange and to withdraw material from the system.
2.1.2 Flora and fauna
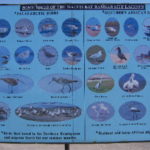
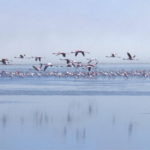
A unique and abundant birdlife is present in Walvis Bay sustained by the high productivity of sea life and plankton, due to the nutrient-rich Benguela current. The protected wetlands are covering the southern most part of Walvis Bay (Figure 2.1). In the lagoon wading birds, rather than seabirds, predominate. It supports more water birds than any other coastal wetland on the southern African coast (Figure 2.2). About 200,000 migratory birds join the resident population every year; up to 250,000 birds are supported at peak times during the summer season making the lagoon an irreplaceable national asset [1].
2.1.3 Salt works
A vast area of previous tidal flats has been utilized for salt production in open salt pans which are separated by earthen dams from the bay. About 55 million m3 of saltwater are pumped per year from the bay into the system of salt ponds. The pumping process is controlled by measuring the evaporation in the various saltpans and is crucial to be maintained in order to not to disturb the salination process. The effluent is discharged via a pipeline into the open sea west of the peninsula. These pans, through their extensive land reclamation and physical barrier to changing tides, have changed the ecology of the lagoon. However, up to half of the birds in the lagoon are feeding in the shallow pans that have a steady artificial influx of particles and nutrient-rich water that sustains the benthic and pelagic food-chain. Additionally the pans help to reduce the intrusion of aeolian sands from coastal beaches into the lagoon.
2.1.4 Aquaculture
Larger plots in the western areas of Walvis Bay are projected for aquaculture development. A significant vulnerability of filter feeding organisms such as oysters for high sediment concentrations is to be expected.
2.1.5 Waterfront development
A new urban waterfront development is envisaged between the lagoon entrance and the existing port premises. The available plot is rather limited in size. The proposed shift of the causeway provides extra space for such development.
2.1.6 Pollution sources
Potential sources of pollution originating from port operations are effluents from fish factories (mainly as Biological and Chemical Oxygen Demand – BOD/COD), spills from bunkering oil or other accidents and from ship and oil rig repair. Potential risks from these emissions are expected to be reduced by the new container terminal as the future port basin will be physically separated from the lagoon.
3 Hydrodynamic studies
To determine the influence of the planned new container terminal and the associated construction works on ecological, hydraulic and morphological conditions at Walvis Bay, a comprehensive numerical modelling programme was required.
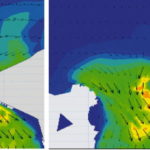
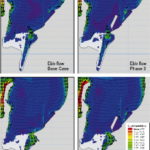
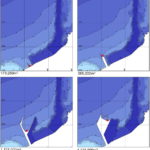
The modelling runs have been performed for the existing situation as well as for the future development Phases 1 and 3. All modelling has been carried out by application of various modules of the MIKE21 modelling package (Danish Hydraulic Institute) and has been calibrated by available measurements (for reference points, see Figure 2.1). An example for the modelled tidal induced current pattern before and after implementation of the container terminal is given in Figure 3.1. The results from modelling were analysed in detail and the following has been concluded:
• The new container terminal has insignificant influence on the water levels in the bay and the lagoon (in average below 2 mm, max. evaluated 6 mm at one location during spring tide)
• The current pattern in the bay changes as such that the large scale eddy is shifted further to the north. The actual flow velocities change only to minor extent
• The flow pattern at the lagoon entrance is adjusting moderately to the new situation during flood phase (Figure 3.2). The velocities at the lagoon entrance are changing insignificantly: in average not detectable (< 2 mm/s), maximum deviation below 10 mm/s
• The residence time of water in the lagoon is increased by 10–15 % due to the artificial extension of the lagoon »neck« by the new terminal. This was observed independent of the development phase and most distinct near the lagoon entrance. According to the trophic principle this results in a reduction of nutrients available for the water fowl population of much less than 1 %
• Potential intrusion of effluents from fish processing plants located north of the commercial harbour into the lagoon is apparently reduced after implementation of the new container terminal
• The sediment transport pattern in the bay changes only to minor extent. Local adjustment to the changed flow conditions occur which is normal in dynamic coastal systems. No significant erosion or accretion patterns have been observed in the modelling
• Wave conditions are not affected in general besides local sheltering and diffraction effects
4 Challenges of dredging and reclamation
The geological development of Walvis Bay has resulted in partly anoxic soil conditions which bring certain challenges to dredging. Large sulphuric gas eruptions occur on a regular basis at Walvis Bay and even along the ocean shore. The management of fines in view of spillage and potential contaminations of the environment is generally a crucial issue in dredging. Two principle dredging operations have been considered for the construction of the new container terminal:
• Dredging of (largely suitable) material by Cutter Suction Dredger (CSD) directly pumped on the reclamation area
• Dredging of (largely unsuitable) material in the access channel by Trailer Hopper Suction Dredger (THSD) and disposal offshore
Spill of fines during the actual dredging process with a CSD is limited since all loosened material is directly collected in the pipelines. Spill may however occur during overflow of fines from the reclamation area depending on material properties and measures taken (e.g. reclamation design, water boxes).
Dredging with a TSHD shall be performed such that all loosened material is absorbed in the ship hold whereas overflow dredging is not recommended for the soft materials expected in the access channel.
Based on the borehole descriptions and sieving curves it was estimated that 10–15 % of the dredge material is silt size. The fill material requires compaction to reach adequate density for the future container terminal operations. Compaction is enhanced by a certain portion of fines in the fill. At least 50 % of the fines of the dredge material shall therefore be kept within the reclamation.
4.1 Sediment characteristics at Walvis Bay
In ancient times the Kuiseb River has deposited sand and gravel material in a delta. The top of these deposits is found at around -20 m CD. The sand material discharged by the river has been partially reworked by the sea, due to which shells are mixed into the mainly fluvial sands. After forming of the peninsula thick layers of diatomaceous silt were deposited. Some period of lower sea levels has most likely lead to consolidation and compaction of the deep silt layer overlying the delta sands.
On top of the old delta and consolidated silt alternating layers of sand and silt deposits have formed by fluvial and coastal processes in more recent times. The sediments found in the envisaged dredging and reclamation areas at Walvis Bay consist of:
• Sand: layers of fine to medium siliceous sand, with shell content between 5 % and 15 %.
• Diatomaceous silt: material occurring at the project location as i) diatomaceous silt layers and ii) lenses in (clayey) silty sand. The sandy clayey silt layers are relatively cohesive when wet, depending on the sand and clay content. The diatomaceous silt is expected to fully disintegrate during dredging, and arrives as slurry in the hopper or on the reclamation site. Deeper diatomaceous silt layers (below -20 m CD) are stiff to hard, showing SPT values of 25 up to 40. All silt samples were found to be non-plastic which indicates that the material is siliceous in origin, and basically consists of very fine particles, and not of clay minerals. The material from the shallower silt layers, however, with still a considerable organic content and therefore black / greenish in colour, will settle slowly and maintain high water content for a considerable time.
• Diatomaceous ooze: Material of very low density around 1,200 kg/m3 showing a very high organic content. The organic material taken from samples is still green inside and partially black and settles very slowly. Ooze material not confined in the coarser fill fractions is expected to stay afloat during dredging and reclamation operations and can possibly not be retained by water boxes.
Due to the anoxic environment in the sediments of the bay, the decay of diatoms creates H2S and CH4 gas which accumulates in lenses. During dredging the release of gas is to be expected, making special health and safety precautions (e.g. degasification on the pumps, pressurized bridge and engine room) mandatory.
4.2 Control of fines at reclamation area
The main source of fines spill was expected from the overflow of the reclamation area which may still contain about 40 % of the originally present fine fraction (4–6 % of the total filling volume). Three different levels of fines control from the reclamation works have been studied:
• Open reclamation and free release of fines into the bay
• Restricted silt release (silt trap)
• Full confinement of fines in reclamation footprint
Option 1: Open reclamation
Option 1 was not considered efficient because confinement and control of fines is limited. To reduce the spread of fines and to allow some control regarding the flow direction of the suspension, a rock containment bund on the south and west side of the reclamation area would be essential. The bund construction shall always be 200 m ahead of the pipe discharge on the reclamation area. Reclamation of the entire area to above sea level (+2.0 m CD) and to final level of +4.5 m CD will start from the southern side. Temporary sand bunds may be required to direct discharge from the filling pipes. Option 1 has been used as conservative approach for the plume modelling.
Option 2: Restricted silt release
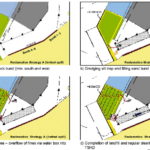
In addition to the enclosing rock bund (as for Option 1) a silt trap shall be dredged to about -15.5 m CD in the port area to which the run-off of fines from the reclamation area shall be directed. During the dredging campaign the silt trap has to be monitored and fines have to be removed and disposed off (for phasing of dredging, refer to Figure 4.1).
As silt outflow into the dredged basin northeast of the bund is allowed, the dredging could start when the bund is min. 200 m long. The inner slope of the rock bund is to be covered by geotextile to minimise the loss of fines through the core. The final enclosure of the reclamation area is achieved by a (sand or rock) bund above sea level connecting the north-eastern tip with the completed causeway. Water boxes shall be installed at the shortest distance to the silt pocket and closest to the southern area of the basin to minimize risk of fines spread around the northern corner of the reclamation.
The central terminal area is reclaimed in strips, starting form north and working towards south using temporary sand bunds
to the reach final reclamation level of
+4.5 m CD. The amount of fines retained is controlled by the water level in the basins maintained by the water boxes.
a) Implementation rock bund (minimum south and west perimeter)
b) Dredging silt trap and filling sand bund
c) Fill reclamation area – overflow of fines via water box into silt trap
d) Completion of landfill and regular clearing of silt trap by TSHD
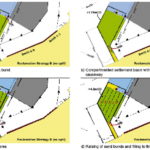
Option 3: full confinement of fines
In order to retain the maximum amount of fines a separate confined settlement pond is required. The water discharge from the reclamation area will be controlled by water boxes to prevent release of fines into the bay. The fines discharged and accumulated in the settlement pond need to be dredged by a cutter dredger in the final stage and loaded into a hopper for offshore disposal. The most favourable / economical location for the pond is assumed within the reclamation area for the Phase 2 development (Figure 4.2).
The siltation pond is subdivided in two compartments with the first compartment being an open settlement area (free outflow from reclamation). Between the two compartments as well as at the outlet towards the port basin two water box systems, engineered to create low flow velocity conditions, need to be installed.
The reclamation process is from south to north, to convey excessive fines towards the siltation ponds. The material filling is completed in layers (e.g. +1.75 m CD and +4.5 m CD) by application of temporary sand bunds. The silt can remain in the siltation pond and be removed at a later stage. The dredger capacity and thereby the speed of reclamation may need to be adjusted to the required outflow concentrations.
a) Full enclosing rock bund
b) Compartmented settlement basin with water box / filling of causeway
c) Filling of terminal area
d) Raising of sand bunds and filling to final height
4.3 Modelling of sediment spill during reclamation works
Plume modelling has been performed for the reclamation activities taking into account Option 1 (open reclamation with free outflow of fines), which is conservative compared to the other options described. For the assessment of suspended sediments all material smaller than 75 µm (about 130 kg/s) was modelled as if it was put into suspension. This is a conservative approach as the coarser fractions will entrap part of the fine sediments which will therefore settle close to the discharge pipe.
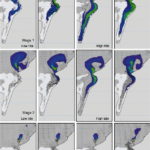
The reclamation work during Phase 1 has been assessed at four modelling stages regarding the spread of fines. The approximate total dredge volume per stage is given in Figure 4.3 (the red dot indicates the discharge location).
From the modelling it was apparent that the initial Stages 1 and 2 (construction of the causeway) are the most critical periods during the reclamation works. In these stages of construction the sediment plume is spread in front of the lagoon entrance, from where it partly enters the lagoon during the subsequent flood (see Figure 4.4, showing the most extreme intrusion of the dredging plume into the lagoon for a common wind situation, 14 m/s from south). In Stage 3 and 4 the effects on the lagoon are diminished which was also concluded for the future development Phases 2 and 3.
The concentration of suspended sediment in the lagoon during Stage 1 may rise to 0.5–1.0 kg/m3 which is higher that the commonly accepted value of 0.15 kg/m3. However, the exposure of the lagoon to increased sediment loads will occur only for a short duration (less than one week). From the moment that the outer bund is extended as far as Stage 3, the lagoon is sheltered from the dredging activities (see Figure 4.4).
The total sediment intrusion into the lagoon during construction of Phase 1 is estimated below 500 t, equivalent to about 0.25 mm of sediment deposit on average (locally up to approx. 3 cm) which is much less than the annual wind blown sediment intrusion into the lagoon, estimated at 25 mm in average per year [4].
5 Way forward
The hydrodynamic and morphological changes in context with the new container terminal were found to be insignificant for the investigated situations and also the plume modelling had shown that impacts from fines spread into the bay and lagoon are relatively small and tolerable because of their short duration.
The final EIA report concluded that the potential impacts of the new container terminal during construction and operation are acceptable in general. Mitigation measures, where proposed, are defined in the respective environmental management plans (EMPs) including monitoring requirements. The footprint of the terminal is not affected and the EIA has been approved by the relevant authorities. Construction works for Phase 1 are in tender stage.
Authors:
Dr. Hendrik Bergmann,
Delta Marine Consultants (DMC), Gouda
Milcar Vijlbrief, DMC
Erik ten Oever, DMC
Elzevir Gelderbloem,
Namibian Port Authority
Dr. Hendrik Bergmann, Milcar Vijlbrief, Erik ten Oever,


