Herbert J. Koelman, who won the COMPIT Award with the following paper, looks into the future of CASD. Finally, he elaborates three possible scenarios which reflect general trends in programming and the daily use of computers
1. Introduction
In this paper an outlook is given on Computer Aided Ship Design (CASD). I restrict myself[ds_preview] to the mid-term – say the next decade – because a longer period cannot be foreseen. The basis for the outlook is threefold: (1) our experience with software development and contributions to research projects, (2) some notions from literature, and (3) personal observations and projections. Addressed will be five – more or less – disconnected subjects:
1. Design and representation of ship shape; this includes the external shape (hull) and the internal shape (bulkheads, decks and compartments).
2. Collaborative ship design.
3. A plea for the revival of empirical prediction methods in ship design.
4. Future scenarios.
5. The model of the ship design process.
A general conclusion at the end of this paper was omitted. Instead each section ends with a conclusion of the particular section subject.
2. The shape of things to come
One of the things that makes our sector unique is the design and representation of the hullform of a ship, where so many technical and aesthetical aspects are related to. Although much has already been said about this subject, some new developments can be noticed. These will be the subject of this first section, first on the virtual representation and secondly on tactile objects.
2.1 How can we hang on to a dream?
There is a bug within the heart of our industry, which is not an accidental software fault, but a deliberate and collective surrender to an inapt modelling method: NURBS surfaces for ship hull modelling. I was professionally educated with pencil and paper, and remember very well the excitement when the first experiments with parametric bivariate B-splines showed a hullform-like surface on the screen of my Apricot 8086 computer. This was around 1983. In many places in the world similar work was done and the same conclusions were drawn. Rapidly the B-spline surface, and a little later NURBS, became the de facto standard for ship hull modelling. However, when applied in practice quite some disadvantages showed up. The strange contradiction is that in private communication with practical ship designers those drawbacks have been commonly recognized and shared, but publications on the issue are scarce. For example, in COMPIT a paper was devoted to this subject, albeit ten years ago, Koelman (2003). A recent overview paper on CASD, Sharma et al. (2012), drew the same conclusion: NURBS are not particularly suitable for ship hull form design. Although Sharma et al. proposed an alternative, it was not very well elaborated. Koelman and Veelo (2013) have made some further analyses and suggestions, with a number of alternatives sketched, falling into two categories: approximating methods and interpolating methods. Approximating methods continue to use the same paradigm as traditional NURBS surfaces, in which the surface shape is derived from distinct control points positioned in the vicinity of the surface. Solutions include:
• T-splines, see e. g. Sederberg et al. (2003) for a general background and Sederberg and Sederberg (2010) for an application aimed at ship design. T-splines overcome the rectangularity limitation of NURBS. However other drawbacks continue to exist (such as the indirect control by
means of the vertices, or the fact that no variations in knot spacing across faces and T-joints are allowed).
• NURBS with extraordinary points, Cashman et al. (2009). This is another generalization of NURBS, supporting higher (but odd) degree surfaces.
• Subdivision surfaces, Nasri (1987). Methods for direct evaluation of shape and curvature exist, Stam (1998), as well as solutions against impurities around extraordinary points, Peters (2000). Subdivision surfaces have been commercially available in MCAD systems for half a decade, Cashman (2012).
• Manifold surfaces. This is another approach to modelling free form surfaces of arbitrary topology based on the concept of overlapping charts, Grimm and Hughes (1995). The method was further elaborated in many more publications, resulting in very high quality surfaces well suited for various kinds of numerical analysis.
• To stick with NURBS surfaces, while trying to overcome the fundamental problems with user interface wizardry. For example: N-sided holes can be filled with N smaller NURBS patches, Piegl and Tiller (1999).
With an interpolating method, on the other hand, a coherent network of curves is constructed and maintained, on which surfaces are interpolated which fill the holes between the curves. Some solutions include:
• To apply a wireframe network, where the holes are »filled in« with surface patches, as e.g. obtained by transfinite interpolation. Such a solution was proposed e.g. in Michelsen (1995). Furthermore, work on the smoothness of such a network and the continuity of derivatives along the edges and at the corners of the surface patches is reported in Ye and Nowacki (1996), Nowacki et al. (1997), Westgaard and Nowacki (2001).
• To extend the wireframe from the previous method with a solid model in order to ensure topological consistency. This solution was first proposed in Jensen et al. (1991), while the first application in ship hull modelling was Koelman (1997), where it was baptized hybrid method. This method contains three constituents: a) a B-rep solid model, b) methods for curve fairing, and c) methods for interpolation of N-sided surface patches.
Finally, the question is whether we will see the NURBS paradigm replaced by a better solution – with the academics of Sharma et al. (2012) now convinced there might be a momentum for change. However, there is another factor in play, which is the data exchange practice. Being conceptually simple, the NURBS method has gained wide support in Product Data Transfer (PDT) standards, notably in DXF and IGES. Support for the sketched alternatives is often not readily at hand in such standards. Solutions can be found in converting the alternative native representations into one of the formats supported by the standard, but the shift to more advanced ship hull representations would certainly be stimulated if the popular PDT standards were extended.
2.2 This year’s model
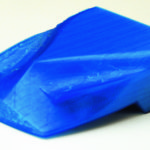
These days it is hard to read serious newspapers without being flooded by articles on 3D printing (a. k. a. rapid prototyping, layered manufacturing or other fashionable terms). Those with a backlog will find a good summary in NN (2012a), www.economist.com/node/21552892. Although reflections on the impact of 3D printing on the structure of the global industry or on the distribution of labour over the world are fascinating, we shall restrict ourselves to its meaning for ship design. For this purpose, I experimented with the Ultimaker 3D printer, www.ultimaker.com, a low-cost Do It Yourself (DIY) printer, which builds up the model layer by layer with molten polymer material. The technology is called Fusion Deposit Modelling (FDM). A movie of this printer in action, producing a cargo vessel demi-model, can be found on http://youtu.be/L91vZ8iQQ50. An example Ultimaker print of a ship hull is shown in Fig. 1.
My experiments led to these conclusions:
• A 3D print of the hull provides a distinct view of the hull shape. Strangely, even people with experience and background of reading lines plans or rendered views see things differently with a 3D print. But especially for other stakeholders in the design process, a tactile model, no matter how small, gives natural insight into the shape.
• The accuracy of the printer (within 1/5 mm) is more than sufficient to transfer the (subjective) notion of shape. On the downside, the shrinkage strain in the polymer causes a slight deformation. This is hardly noticed, but e. g. in an assembly it can be annoying. Fig. 2 shows a model that was printed in two parts, port (PS) and starboard (SB), and glued together. Here the shrinkage strain causes a fissure between the parts. Fig. 3 shows the same launch, now printed with Selective Laser Sintering (SLS). This technology is too expensive for DIY, but offers much higher quality.
• DIY printing is cheap on investment and material. The downside is that the prints require some fine tuning and may sometimes fail. In the first Ultimaker models, we experienced failure rates of tens of percents. However, with the latest 2013 modifications, this appears to be much improved.
• Computer representations have to fulfill specific requirements to be suitable for 3D printing. Notably, the printing software requires the representation to be a solid model; so the idea that lines drawings or collection of unconnected surfaces can be used as basis for a 3D print is a bit naive.
• With this FDM layered manufacturing, a print requires a flat base layer of sufficient size. For example, it is not possible to print an Eiffel Tower model upside down, because due to the lack of a base layer the object will turn over. Thus complex artefacts have to be segmented into parts which can be built from a flat base layer.
• The parts must be glued together afterwards. For example the internal ship model of Fig. 4 was segmented with a provisional subdivision algorithm, printed in four parts, which were finally assembled manually. The optimal subdivision strategy for such an object is still an open issue.
Given the enormous attention in the media and the significant resources that are now being put in the development of 3D printing technologies (a Google search of »3D printing« and »investment« gives 3.040.000 hits), we may expect that new technologies will emerge that will make 3D printing much more user friendly and accessible, just as in the early 1980s the PC hardware grew from a hobby machine to a professional product in only a few years. Given the price difference between DIY and high-quality machines, the most likely model is with a cheap DIY on your desk, for the rapid result, and a print shop in your town for high-quality prints. And finally the big question: Will the designs of our ships benefit from 3D printing? I guess that we will not design better products per se; however, the communication in the design and manufacturing process will improve, leading to a better understanding.
3. Let’s get together
Our sector has seen a dispersion of activities over the past decades. There have been times when ship designs were mostly produced by the design team of a shipyard, which could oversee all design aspects, and performed most of the design activities in-house.
Nowadays, activities are distributed over multiple individuals or small groups, possibly scattered over the world, and working with different design software and analysis tools. This fact asks for software tools where people can work collaboratively, and geographically dispersed, on the design of a ship. Aimed at the engineering and production phases of the ship such collaborative tools are quite established. So, in this section we will only concentrate on design. The first thing to do is to sketch the requirements for collaborative CASD.
3.1 Just what I always wanted
Li et al. (2005) make a useful distinction between horizontal and hierarchical collaborative CAD. In horizontal collaboration, persons from the same discipline are co-designing in parallel or in a serial way. In the hierarchical mode, teams of different disciplines are involved. Examples of the latter are the collaborations with specialists in hydrodynamics, construction costs estimations, seakeeping, structural strength and production. Horizontal collaboration can further be subdivided into visualization-based systems and co-design systems. In the first category, the emphasis is on a fast distribution of the visual design amongst the peer designers. However, our focus is on co-design systems. According to Fuh and Li (2005) such systems can be classified into three types:
• Communication server plus modelling client (thin server plus strong client). Here, the clients are equipped with full CAD functionality, while the server plays mainly a communication role.
• Modelling server plus visualized-based manipulation client (strong server plus thin client). Here, the main modelling activities are carried out on the server.
• Application or service sharing (peer-to-peer), where the different CAD systems have more or less the same »weight«, and share some of each other’s facilities by means of an API (Application Programming Interface).
In distributed CASD environments we do not see a tendency towards a centralized model, where most design activities are carried out on a single platform, either with a strong or with a thin server. On the contrary, as motivated above, many design groups work with a variety of tools, each for a specific task and each operating quite independently. However, the different systems need to collaborate and without restructuring many software tools – which is considered rather unrealistic – the third model can show a way out: on a peer-to-peer basis, with systems »peeking« into each others data and methods. In the next sub-section this model will be worked out.
3.2 Bits and pieces
The idea of a software tool as ad-hoc combination of components was investigated in the Dutch Innovero project, de Koningh et al. (2011). Experimental software implementations consist of:
• An internal ship hull modelling tool, based on a Binary Space Partitioning (BSP) method. This tool was recently equipped with APIs in order to facilitate peer-to-peer communications.
• A provisional XML dictionary. After long deliberations the consortium decided not to aim at a top-down designed dictionary, but to let it organically grow from the communication requirements, just as with natural language dictionaries, similar to the approach of Whitfield et al. (2011).
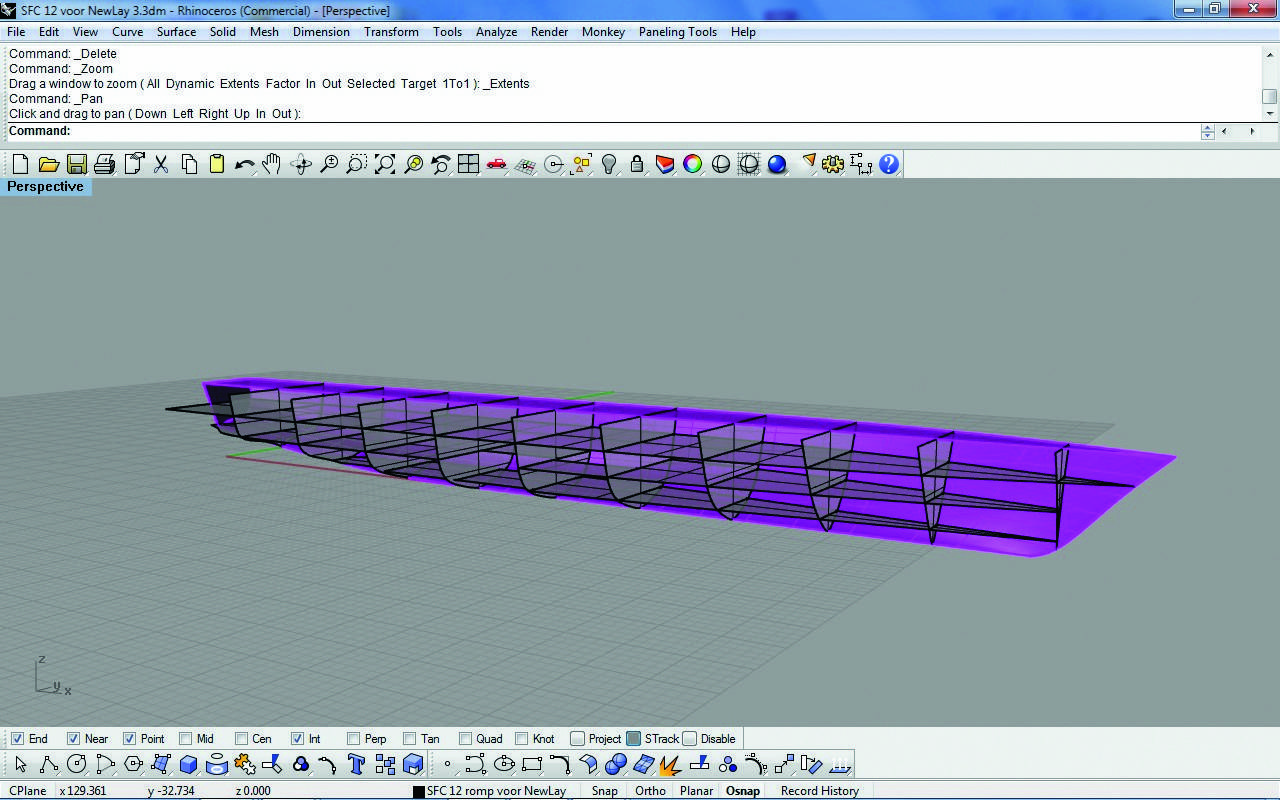
• Two general CAD systems. Two, because two project partners use different CAD systems; the Eagle system (http://macrovision.ie) and Rhinoceros (www.rhino3d.com). Despite different functionalities in Eagle and Rhinoceros, with both CAD systems a similar confederation of software systems was achieved, enabling transfer of the internal geometry from the BSP-based program to the CAD system and vice versa (Fig. 5).
• Communication of the XML content over TCP/IP (Transmission Control Protocol/Internet Protocol) on an ad-hoc basis.
A proof-of-concept project was the generation of two-dimensional design drawings in a general-purpose CAD system based on information as available in other connected design tools. The background for this work is that on one hand the design geometry and topology is available in specific ship design tools, while on the other hand two-dimensional overview drawings are important to provide global design layout information. These drawings are distributed to other persons downstream in the design and production process. For that purpose, such drawings (typically a general arrangement plan or a tank capacity plan) should also be visually appealing, and preferably formatted in the house-style of a specific shipyard or design office. The aim of this project is the automatic generation of such 2D drawing, albeit in an easily configurable way. This project was in collaboration with Conoship International, performed with the Eagle general-purpose CAD system. With the Eagle language the different ship elements where requested from the BSP-based design tool, processed, and equipped with the desired attributes. Although at the moment of writing the project is not finalized, there are strong indications that its goal can indeed be achieved without the assignment of significant resources. Fig.6 shows an automatically generated double-bottom view visualized in Eagle.
In conclusion, a system consisting of relatively light-weight application programs or CAD applications, communicating over a relatively simple peer-to-peer communication infrastructure, can provide a very attractive and flexible solution. And this approach offers also a way out of over-
engineered monolithical software packages which have the danger to combine complexity with inflexibility.
4. The empiricists strike back
The advance of the computer has opened up new possibilities for the ship designer and brought many handy tools, such as CFD (Computational Fluid Dynamics), advanced optimization algorithms, and product model sharing. However, with the emphasis on these new possibilities an elder class of tools, the empirical prediction methods, is being neglected. In particular for concept studies and the early design stage, such methods have proven to be extremely useful.
Take for instance resistance prediction methods such as from Savitsky and Holtrop & Mennen, or steel weight approximations by Schneekluth or Westers. Unfortunately, these methods have not been updated for modern designs or construction methods. The most recent Holtrop & Mennen publication is from 1984, and the steel weight approximations date back to the early 1960s. This is peculiar, not only because the need for such methods is compelling, but also because these days empirical methods could be built with today’s possibilities, such as:
• Massive statistical analyses, such as regression models with a large degree of freedom, or response surface models.
• Collecting empirical material used to be tedious, for example doing model experiments. However, numerical experiments based on FEA (Finite Element Analysis) or CFD could generate »numerical series«.
• In »those« days a prime requirement was to communicate the method in a condensed way, by using equations with only a few coefficients or graphs. But nowadays things are much easier. Large amounts of numerical data can easily be distributed and just as easy being read into a computer program or a spreadsheet.
• The increased processing power brings additional features within reach. For example by extending the prediction method with confidence limits. In this fashion a probabilistic steel weight method might be possible, where not only the steel weight is predicted, but also its probability distribution.
In this respect, the occasional publication with a fully elaborated empirical method is a delight, e. g. Bertram and Mesbahi (2004), or the compact overview of empirical prediction methods for catamarans in Haase et al. (2013). And notably Hekkenberg (2013), which will have a sequel in a Joint Industry Project in the Netherlands, aimed at the construction of empirical prediction methods for inland waterway vessels. I hope that this work will be an inspiration to other scholars to work in this area. And remember: Eternal fame will be yours. For what is the reason we are still familiar with the names of e. g. Puchstein or Lap?
5. Scenarios on the use and advancement of computers and their impact on CASD
We all are aware that the future is difficult to predict. There are so many disrupting mechanisms and unknowns that simple extrapolations are most likely to fail. Moreover, predictions may be self-fulfilling or self-destroying. For this reason some fortunetellers from major companies find it more appropriate not to present a deterministic prediction, but to sketch different lines of likely scenarios. Restricted to the topics of COMPIT, I would like to postulate three mid-term scenarios – say for the next decade – on the use and advancement of computers, and their impact on CASD:
• Fragmentation, symbolized by the collapse of MS-Windows. Time was that Microsoft (MS) ruled the world. However, in the technology battle of today its role seems to be over; for example a briefing on future platforms, NN (2012b), reports in depth on Apple, Amazon, Google and Facebook, but spends only a single word on MS. Although as such the downturn of MS might be a relief for many, the annoying undertone is that no prevailing platform will arise that can mature to mainstream. As such, the lack of a clear winner is not a big disadvantage, it might even be healthy for innovation. But consequences might be that PDT and collaborative design will become tedious. The same might happen on our CASD terrain. For example, as we saw in section 2.1, there are several candidates for the succession of today’s prevailing hull form representation method, which helds the risk of fragmentation.
• The standstill era. In the Netherlands the 18th century is known as the »wig age«, the »pruikentijd«. This is generally considered to have been a standstill era, where the country still floated on its successes of the Dutch glorious Golden Age, however, with little innovation. The same might held for the future of computing: Overwhelmed by the magic of the computing and connectivity power the strive for innovation is lost for the moment. Or to condense this scenario in a rethorical question: Do you think that our common desktop tools, such as spreadsheets, word processors and databases have significantly improved since 1986? I don’t. Admittedly, we have gained e-mail and Internet, but for the rest my office productivity was higher in 1990 than it is now.
• A bright young world. In this scenario the focus lies not so much on computer programs, but more on methodological advancement; the development of methods that assist the ship designer in the daily practice, but also at a deeper level help to make our industry more competitive and more pleasant. Obviously, the results will become available as computer applications, however, with more attention to the methodological user friendliness than to appearance and user interface wizardry. This kind of user friendliness also stimulates a common ground for interoperability technologies.
The advantage of scenarios is that we do not have to choose. It is likely that a mixture will become reality. Obviously, everybody will favour the third scenario. But please see that such a choice is not without engagement. This scenario can only become reality if we actively contribute to it and stimulate others to do so, too. And in that way make my other two prophecies self-destructing.
6. Winding down
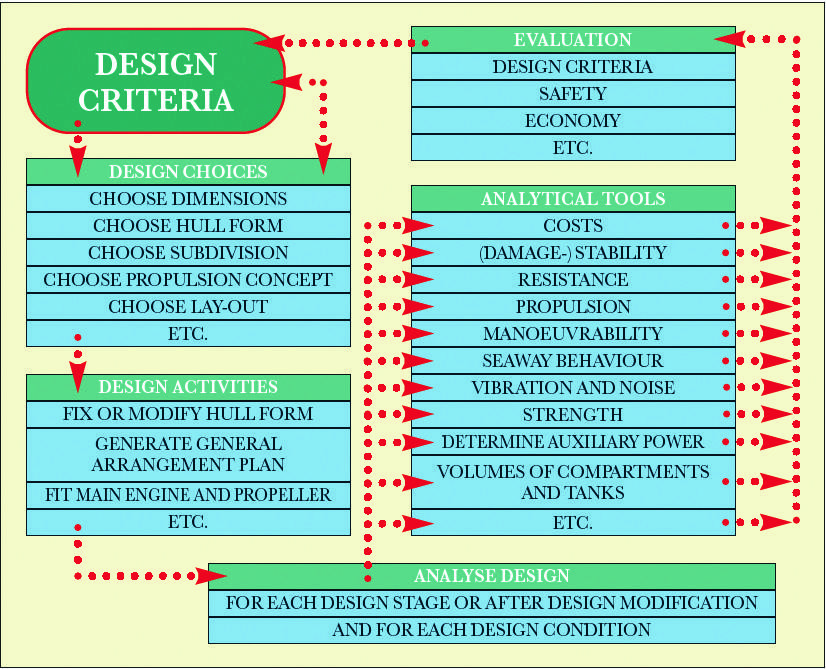
In the section on ship hull form design we have noticed a manifestation of cognitive dissonance: the phenomenon that people tend to adapt their system of values to a certain theory, although empirical evidence or indications do not support that theory. Such discrepancies occur also in other fields, take the common model of the ship design process. Brought back to its basics, ship design consists of two parts: choices and evaluations. Design choices comprise e.g. main dimensions, displacement, layout of tanks and spaces, propulsion concept and structural concept. Evaluations can include computations in the field of speed and power, stability, cargo capacity, tank capacity, endurance and structural strength. The sequence of choose and analyse is reiterated until all design requirements are met (or it can be concluded that they cannot be met at all). This method is commonly depicted as a design spiral, which is attributed to Evans (1959). However, this spiral suggests a fixed sequence of activities, which in reality only seldom occurs. Also the distinct design stages (initial design, embodiment design, contract design, detailed design) may in practice overlap to some extent. Recently we have seen a tendency to omit the sequence notion from the spiral, Nowacki (2009), Harries et al. (2011). We are left then with the model of the toolbox, from which the ship designer can pick his tools as the situation requires. My favorite graphic for such a model is depicted in Fig. 7, Koelman (1999), not that the alternatives are worse, but because it is readily at hand on my desk. Is this methodology thing relevant for the daily ship design practice? No. But a misfit gives novices an incorrect notion of their profession and their activities, and for no reason.
Author:
Herbert J. Koelman,
SARC, Bussum/The Netherlands, H.J.Koelman@sarc.nl
Herbert J. Koelman


