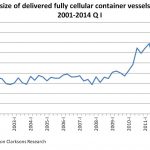
Between 2008 and 2014 the industry recorded a significant cascade effect in liner shipping. The implications for the competition of different container ship size segments are illustrated
The cascade effect in liner shipping is referring to the phenomenon that ever since their introduction in the late 60s[ds_preview], the size of fully cellular vessels has continuously expanded and that throughout this period the vessels sizes across all trade lanes have continued to increase.
As a rule, the largest vessels during the recent years have always been found on the Far East/North Europe as well as the Transpacific trade lane. In both cases, the deployment of the largest units makes sense for two reasons. First: these are the longest routes and thus the absolute incentive to benefit from the economies of scale is felt strongest. Second: in terms of TEU-miles, these two routes account for the lion’s share of container trade, so there is by all means enough cargo to fill even the largest ships.
However, as can be seen especially since the booming Chinese trade expansion, the continuous upsizing of container ships has regularly lead to the biggest newbuildings being deployed on the long East–West routes, where they have in turn pushed out smaller units by both rendering them uncompetitive or simply overshooting the demand growth of the respective trade lane. Those »small« vessels that have been pushed out of the »top-basins« of the cascade-system (Fig. 2) have then been trickling down into other trade basins, where they typically belonged to the largest units and pushed out smaller units themselves … and so on and so forth.
Since 2008, this cascade effect has exacerbated for two reasons: the average size of newly built container vessels, which had been oscillating around 3,400TEU between 2001 and 2008 has soared significantly, reaching a mean of ~5,800TEU between the years 2009 and 2013 (Fig. 1), whilst at the same time trade volumes on the two key arterial trade lanes took a plunge in 2009 and recovered only gradually thereafter. As a result – even though slowsteaming was tying up large amounts of additional tonnage – the global fleet
expansion of the giant container vessels was simply too much to handle for the demand side.
In this article, several databases of liner shipping schedules are analysed to illustrate how the cascade effect has affected the deployed vessel sizes across the key arterial trades around the world as well as the aggregated other deployment areas during the last six years. At the end, the fully cellular fleet will be portrayed in a single diagram in order to illustrate the overlap of the different segments and to develop a better understanding of the intra-sector competition.
Above it all: the Far East/North Europe trade lane
In the second figure, one thing becomes clear at first glance: the Far East/North Europe trade lane (defined as any service calling in either China, South Korea or Japan in Asia as well as in at least one North Sea port) ranks top among all other container routes in terms of vessel sizes. Between 2008 and 2014, the average vessel size has increased from 7,160TEU to 11,284TEU as 183 newly built vessels with an average capacity of around 11,700TEU have been deployed to this route whilst 241 units with an average capacity of 6,800TEU have been sorted out of this trade and ended up mostly on the Pacific Ocean and on shorter East–West trades.
Early in 2008, the smallest vessels still remaining on the Far East/North Europe trade had a capacity of ~5,300TEU, but this figure is misleading, as those were only three vessels and all other units had a capacity 7,900TEU. If it were not for the inclusion of Japan (which is as of today still only being called by vessels smaller than 10,000TEU) into the definition of the Far East/North Europe trade, the average capacity of the ships deployed in the China/South Korea/North Europe trade would have decoupled even further from the industry average fuelling the view, that the Far East/North Europe trade could potentially turn into an individual market with its own supply-demand balance in the future. It is interesting to note that basically all of the newly built 183 vessels which have been introduced to the Far East/North Europe trade did start their trading life on this very trade lane. This is different on the Transpacific routes where more than half of the vessels which are deployed today and which have been built since 2008 were not genuinely introduced to the Transpacific trade, but have been employed on other East-West routes in the meantime, so the true extent of the cascade effect is somewhat hidden in figure 2.
Before looking in greater detail at the other trade lanes, it is also worth pointing out that over the course of the last six years, the Far East/North Europe trade lane has virtually not experienced any other inflow of vessels except from newbuildings. So once ships leave this route, they never come back – underlining the top position of the trade lane in the cascade hierarchy.
Transpacific routes and other East–West lanes
Trade lanes across the Pacific Ocean, including those from Asia to Latin America, as well as those on all other East-West routes have also seen their average vessel sizes increasing sharply. Early in 2014, the average nominal TEU-capacity on these routes stood at roughly 6,200TEU. Thereby both the trades with the US-West Coast but also the South East Asia/Europe and some of the Middle East trades have already been familiar with vessel sizes in excess of 10,000TEU – most of which have been »cascaded out« from the Far East/North Europe trade lane after being initially deployed there during the last five or six years. Looking at the intra-sector exchange, one finds that vessels on Transpacific or other East–West routes seem to be quite interchangeable – the exchange of units is slightly weighted towards the East–West lanes though.
North–South trades
The next layer of the cascade-system seems to be the North–South trades with an average vessel capacity of 3,127TEU in 2014 (up from 2,102TEU in 2008). The capacity of this segment was increased both by newbuildings as well as by a noticeable inflow of vessels from the 2nd tier East–West trades. Some smaller vessels did pour into this basin as well from intra-Asia and other intra-regional routes, but the effect was more than offset by the 311 vessels with average capacities of 2,004TEU and 1,880TEU, which have been cascaded out to intra-Asian trades or other intra-regional trades/lay-up, respectively. Also, 158 units deployed on North-South routes early in 2008 have simply been scrapped so far.
Intra trades and vessels in layup
The remaining three basins show a relatively unique picture with average vessels sizes around ~1,600TEU early in 2014. Starting with the smallest basin, the intra-Europe trades, it seems that this market is somewhat of a counter pole to the Far East/North Europe trade: the only inflow of units here stem from newbuildings (77) and to a minor degree (35) from other intra trades/unknown areas. As a result, the fleet deployed on intra-European trade lanes is relatively young on average. It fits the picture, that only a tenth of the vessels, which have been deployed on intra-European routes early in 2008, have been scrapped. For comparison: a fifth and a quarter of the units deployed on intra-Asian and other intra-routes respectively have been scrapped since 2008.
The intra-Asian trades on the other hand have experienced a noticeable inflow of units from other trade lanes: 193 units with capacities of up to 6,627TEU have found new employment on the fast growing (and sometimes relatively long) intra regional trades. At the same time the only real place where units smaller than 500TEU are still common are the very same intra-Asian trades as some of the ports being serviced here simply do not allow for bigger ships to be handled.
Last but not least, there are all the other intra-regional trades: Africa, Latin America, Black Sea, Middle East, Oceania as well as the units for which early in 2014 no deployment was known or which have been idle for various reasons. A handful of the 870 units in this group have exceeded 10,000TEU, but it can safely be assumed that these were just currently out of service for undergoing maintenance or as a result of skipped sailings during the winter downturn. Taking this into account as well as the fact, that this basin also held the roughly 230 idle units which have been reported by Alphaliner early in 2014, the average capacity of 1,773TEU is probably slightly overstated when intra-regional trades are concerned. This last basin appears to have a rather lively exchange of units with both the intra-Europe as well as the intra-Asian trades. The exchange is in all cases weighted towards the mixed basin though. Additionally, vessels have been pouring into this layer in large numbers from the East-West trades but this has been a pure »one way street« so far – except for a handful of redeployments to short East-West routes (not portrayed because of the small number).
Interim conclusion and outlook
The analysis shows that vessels sizes across all trading areas have increased drastically in size during the last six years, as the average capacity of newly built vessels has increased by roughly two thirds to ~5,800TEU during the years 2009–2013, while at the same time around 870 of the smallest units of the fleet have been sold for scrap.
As of today, it is clear that the Far East/North Europe trade stands at the »top of the food chain«, with the adjacent basins only receiving the spill-over units but never sending back any units. Between the East-West routes and the intra-regional trades stand a thousand (1,005) vessels deployed on the North-South trades, which have seen a steady inflow of units from East-West routes and which pass smaller vessels on down to the intra-regional trades but which are never sending any ships back to upper layers of the cascade-system.
At the bottom of the cascade-system we find the intra-triad, where approximately 2,500 active and 230 idle vessels with average capacities of ~1,600TEU are seeking employment on short intra-regional trades and who receive (mostly Asia) units from some of the East-West- or North-South trade lanes but who exchange units only with other intra-regional-areas – or the scrapyards (a one way exchange too, one might add).
The future perspectives for the cascade effect are quite clear. At the beginning of 2014, the fully cellular orderbook indicated further deliveries with average capacities of 7,028TEU, 8,447TEU, and 8,895TEU for the years 2014, 2015 and 2016 respectively. Whilst the average capacities of deliveries for the latter two years will certainly be adjusted downwards by interim orders for additional smaller vessels, it is evident that the further deliveries of container leviathans will provide further fuel for the cascade effect, especially since the supply growth of ultra large container carriers is set to outperform demand growth of the two largest arterial trades. So the cascading process will very likely continue at the current pace.
The market situation today
Figure 3 illustrates the deployment of the fully cellular fleet as of early 2014. All vessels are grouped according to their trade route in line with the above definitions. The diagram thus helps to understand the typical sizes of vessels deployed on the different trading routes as well as the overlap of the different markets – and the resulting spillover-effects and competition.
All in all, the diagram provides quite a nice insight into two current phenomena. First of all, the vessel sizes on the Far East/North Europe trade do in fact seem to be evolving into a class of their own. The existing overlap with the Transpacific (including Latin America) and other East-West routes is mostly caused by the »small« vessels, which are calling in Japan and which are still not exceeding 10,000TEU. With the imminent expansion of the Panama Canal and the dredging currently underway on the US-East Coast, the overlap stands to increase marginally, as some ports there are already dredging to accommodate the panamax-vessels of the future, probably resulting in some additional 10,000+ TEU vessels on the Transpacific.
Second of all, the long routes all seem to have a lower cut-off for vessel sizes. On the Far East/North Europe trade for example this seems to be around 8,000TEU, whilst vessels with capacities of 4,000TEU or less (once the proud workhorses of the arterial trades) seem to have been rendered mostly uncompetitive on the other East-West routes.
As far as the North-South trades are concerned, the lion’s share of the vessels seems to be bigger than 1,700 TEU. However there still is a considerable overlap between smaller vessels deployed on North-South trades and the intra-regional vessels.
The three large segments at the bottom, intra-Europe, intra-Asia and the aggregate of all other intra-regional trades and the idle units form a large basin with a massive overlap to each other as well as to some
of the North-South trades. And thus it there is a hint, why geographical constraints like for example those of the Kiel Canal seem to be unable to provide shelter against the pressure on the charter rates resulting from the oversupply of the larger vessels: The nautical restrictions of the canal linking the North Sea and the Baltic Sea still do not allow for bigger vessels to transit the busy waterway than before. However,
the pool of possible vessels, which could in fact transit this canal is larger than needed and so, there is a massive competition among vessels from all the intra trades
as well as some of the vessels formerly deployed on North-South routes, who are feeling the brunt of the cascade effect from the upper basins but whose vessels are
unable to exert the same pressure back up the cascade-system as they have been rendered too small to compete on the longer routes.
Michael Tasto


